Maintenance and repair supplier W.W. Grainger (NYSE: GWW) beat Wall Street’s revenue expectations in Q3 2026, with revenue up 11.3% year on year to $5.18 billion. The company’s full-year revenue guidance of $19.9 billion at the midpoint came in 1.2% above analysts’ consensus estimates. Its non-GAAP profit of $12.54 per share was 7.5% above analysts’ consensus estimates.
For more on W.W. Grainger, read our full research report, available free.
W.W. Grainger (GWW) Q3 2026 highlights:
- Revenue $5.18 billion vs S&P analysts’ consensus estimates of $5.08 billion (11.3% year-on-year growth, 2.1% beat)
- Adjusted EPS $12.54 vs S&P analysts’ consensus estimates of $11.66 (7.5% beat)
- Revenue guidance The company lifted its revenue guidance for the full year to $19.9 billion at the midpoint from $19.55 billion, a 1.8% increase
- Adjusted EPS guidance Management raised its full-year adjusted EPS guidance to $47.50 at the midpoint, a 2.4% increase
- Operating margin 16%, up from 11% in the same quarter last year
- Free cash flow margin 10.5%, up from 7.3% in the same quarter last year
- Organic revenue rose 14.9% year on year (beat)
- Market capitalization $65.85 billion
"The third quarter performance reflects our consistent execution and an improving demand environment," said D.G. Macpherson, Chairman and CEO. "As customers continue to turn to us for the products and solutions they need, both our High-Touch Solutions and Endless Assortment segments delivered impressive growth. Following another quarter of strong performance, we are increasing our 2026 guidance and remain on track for an exceptional year."
Revenue growth
A company’s long-term performance is an indicator of its overall quality. Any business can have short-term success, but a top-tier one grows for years. W.W. Grainger’s revenue grew at a decent 9% compounded annual growth rate over the last five years. Its growth was slightly above the average industrials company and shows its offerings resonate with customers.
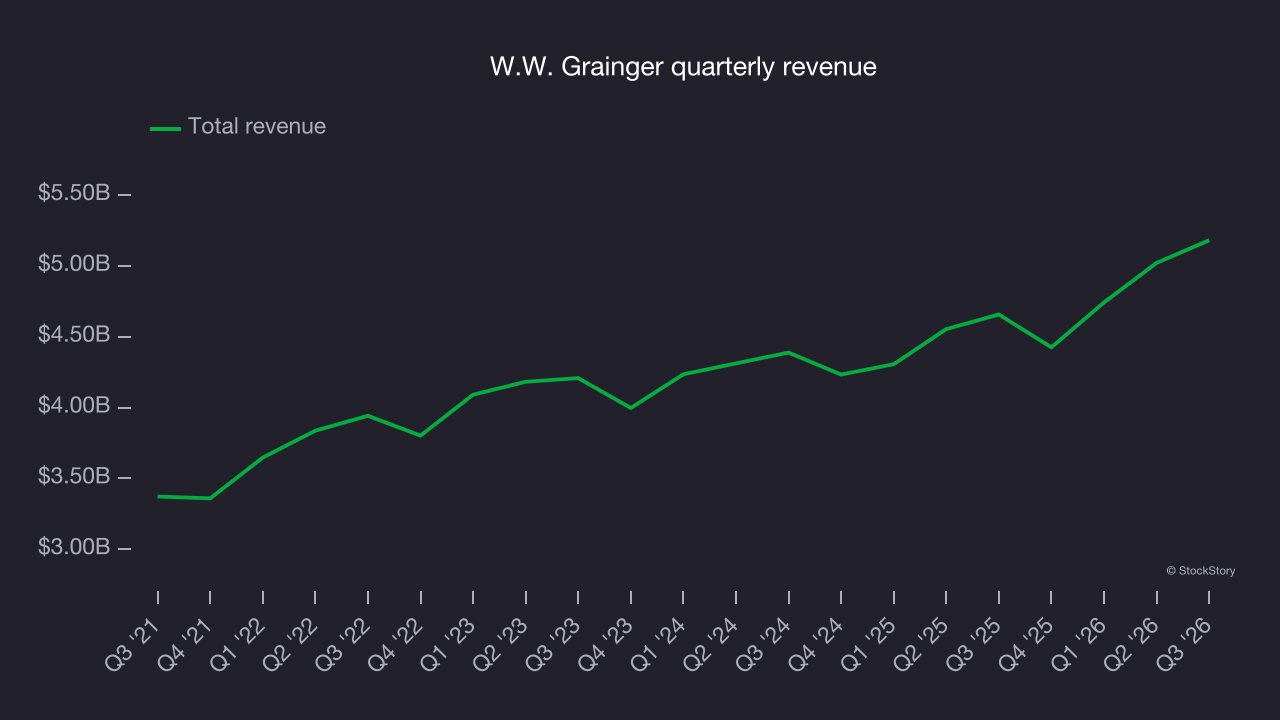
Long-term growth is the most important, but within industrials, a half-decade historical view may miss new industry trends or demand cycles. W.W. Grainger’s recent performance shows its demand has slowed as its annualized revenue growth of 7% over the last two years was below its five-year trend. Decelerating revenue growth is a concern in the sector, as it could signal changing consumer tastes aided by low switching costs. 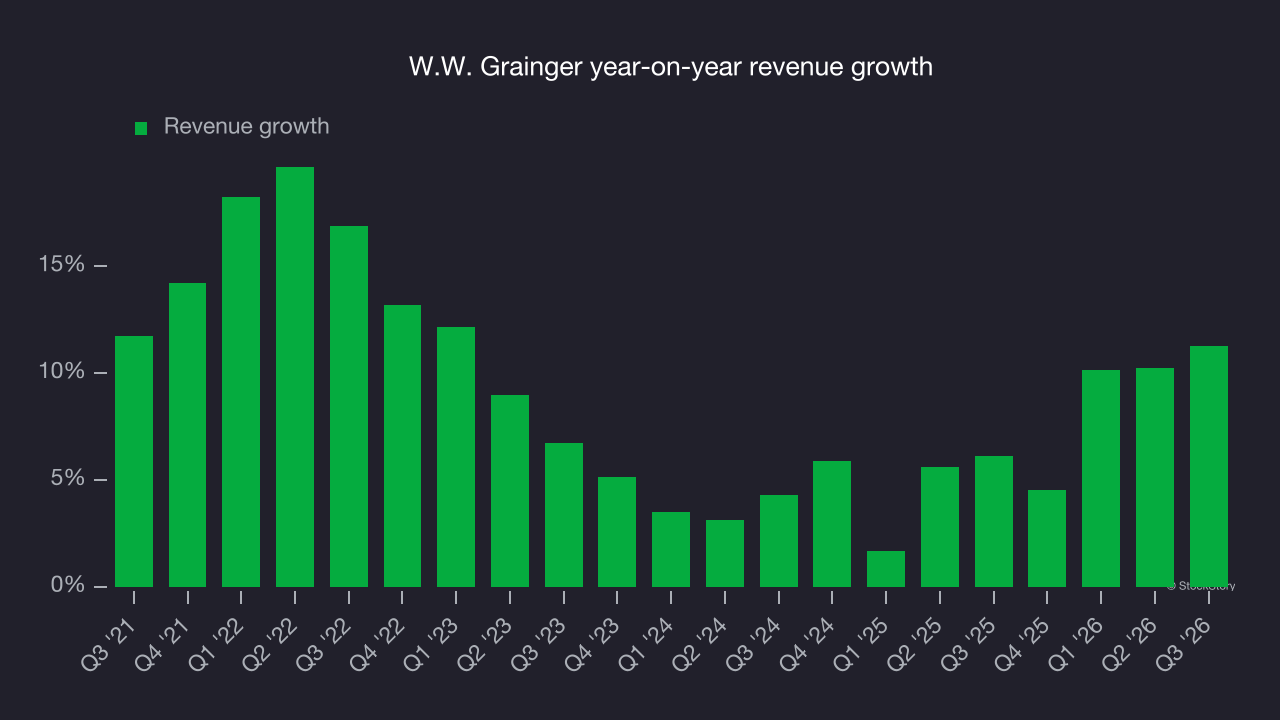
W.W. Grainger also reports organic revenue, which strips out one-time events like acquisitions and currency fluctuations that don’t accurately reflect its fundamentals. Over the last two years, W.W. Grainger’s organic revenue averaged 8.1% year-on-year growth. This was in line with its two-year revenue growth, indicating that core operations, rather than acquisitions and divestitures, drove most of its results. 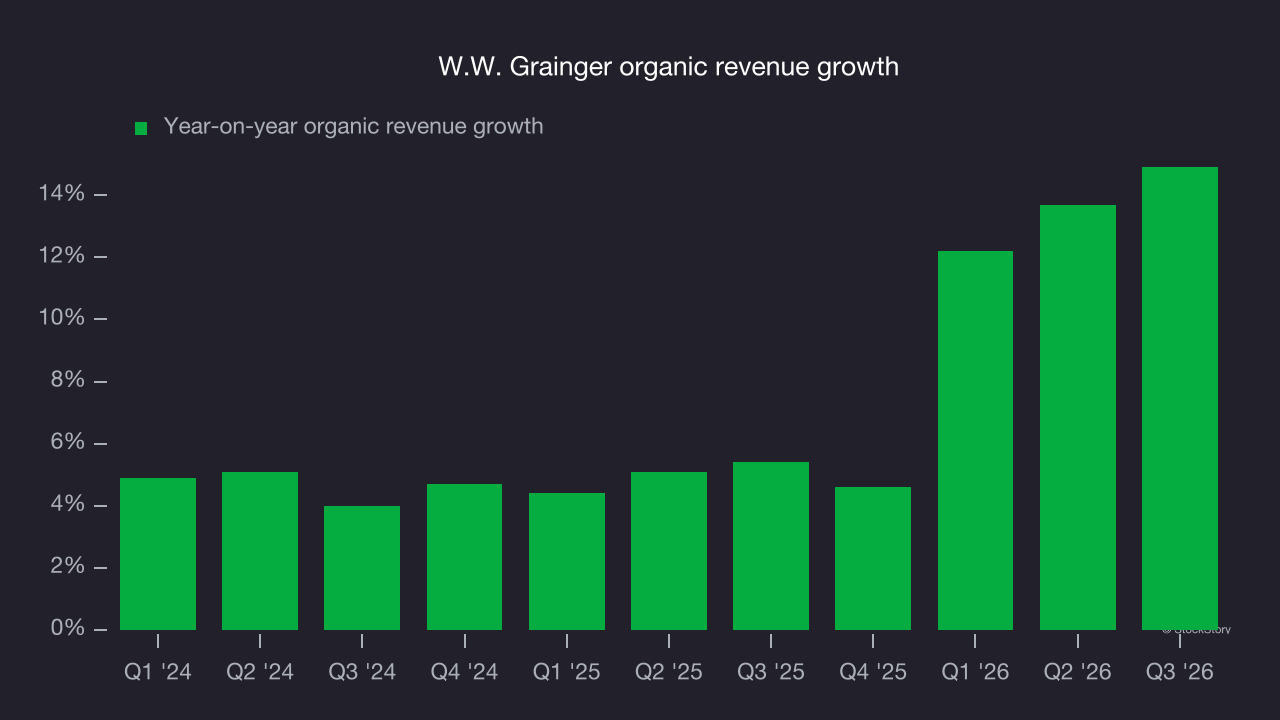
This quarter, W.W. Grainger reported year-on-year revenue growth of 11.3%, and its $5.18 billion of revenue exceeded Wall Street’s consensus estimates by 2.1%.
Looking ahead, sell-side analysts expect revenue to grow 7.2% over the next 12 months, according to S&P, similar to its two-year rate. This underwhelming projection implies its newer products and services will not accelerate revenue growth yet. On the positive side, the company is tracking well in other measures of financial health.
Operating margin
Operating margin is a key measure of profitability. Think of it as net income – the bottom line – excluding the impact of taxes and interest on debt, which are less connected to business fundamentals.
W.W. Grainger has been an efficient company over the last five years. It was one of the more profitable businesses in the industrials sector, with an average operating margin of 15%. This result isn’t surprising as its high gross margin gives it a favorable starting point.
Looking at the trend in its profitability, W.W. Grainger’s operating margin rose by 1.7 percentage points over the last five years, as its revenue growth gave it operating leverage. That expansion shows it’s one of the better maintenance and repair distributors, as most peers saw their margins decline.
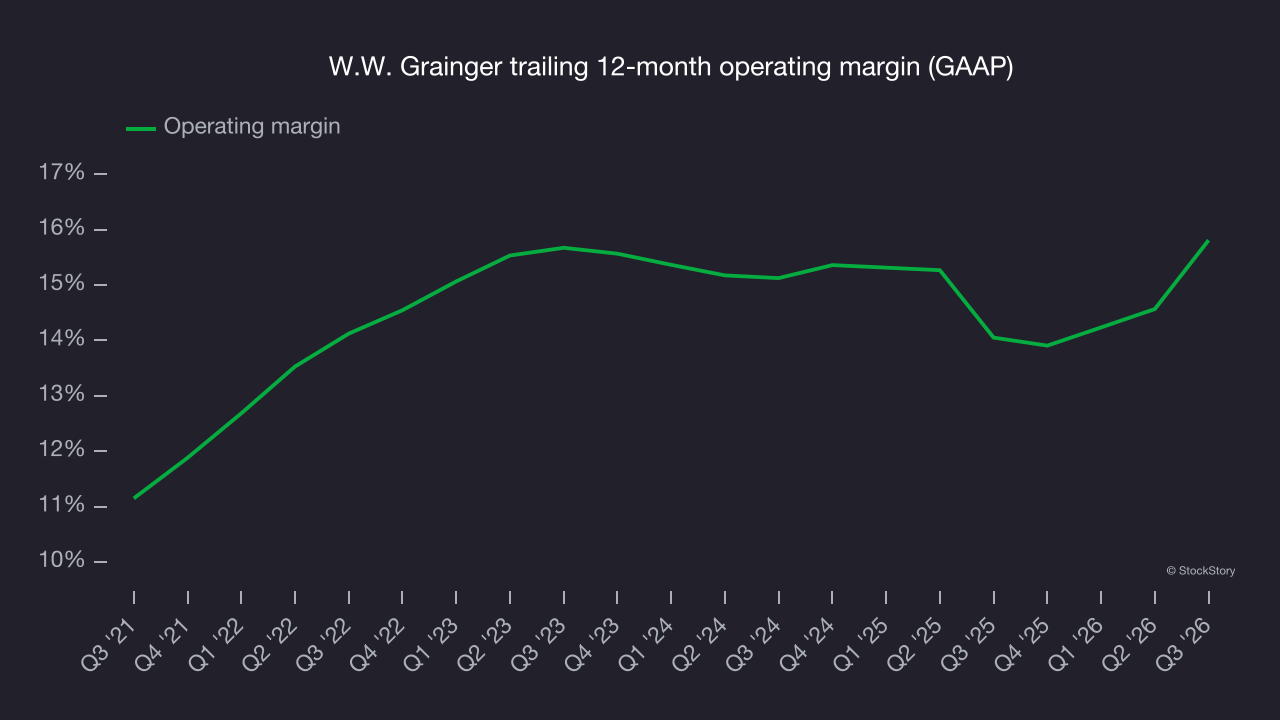
In Q3, W.W. Grainger generated an operating margin of 16%, up 5 percentage points year on year. The increase was solid, and its operating margin rose more than its gross margin, indicating greater efficiency with expenses such as marketing, research and development and administrative overhead.
Earnings per share
Revenue trends explain a company’s historical growth, but the long-term change in earnings per share (EPS) points to the profitability of that growth. For example, a company could inflate its revenue through excessive spending on advertising and promotions.
W.W. Grainger’s EPS grew at a 20.4% compounded annual growth rate over the last five years, higher than its 9% annualized revenue growth. This tells us the company became more profitable on a per-share basis as it expanded.
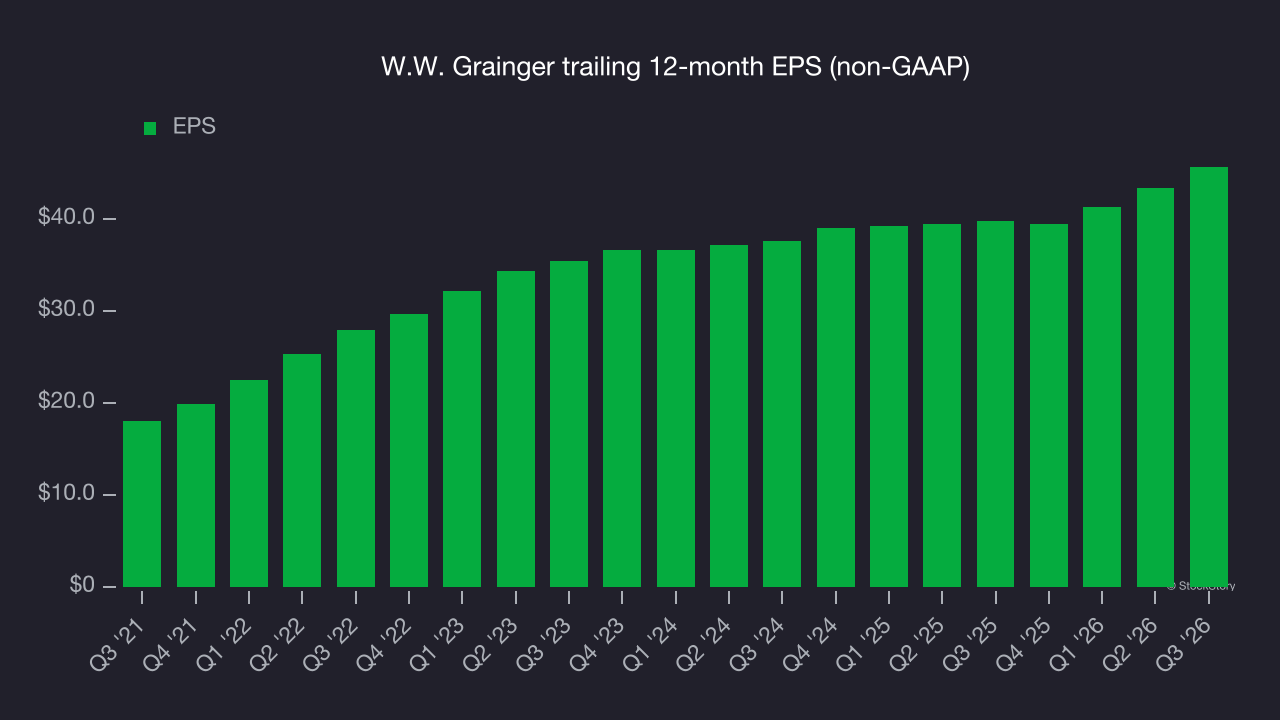
A closer look at W.W. Grainger’s earnings helps explain the drivers of its performance. As mentioned earlier, W.W. Grainger’s operating margin expanded by 1.7 percentage points over the last five years. On top of that, its share count shrank by 9.6%. These are positive signs for shareholders because improving profitability and share buybacks boost EPS growth relative to revenue growth. 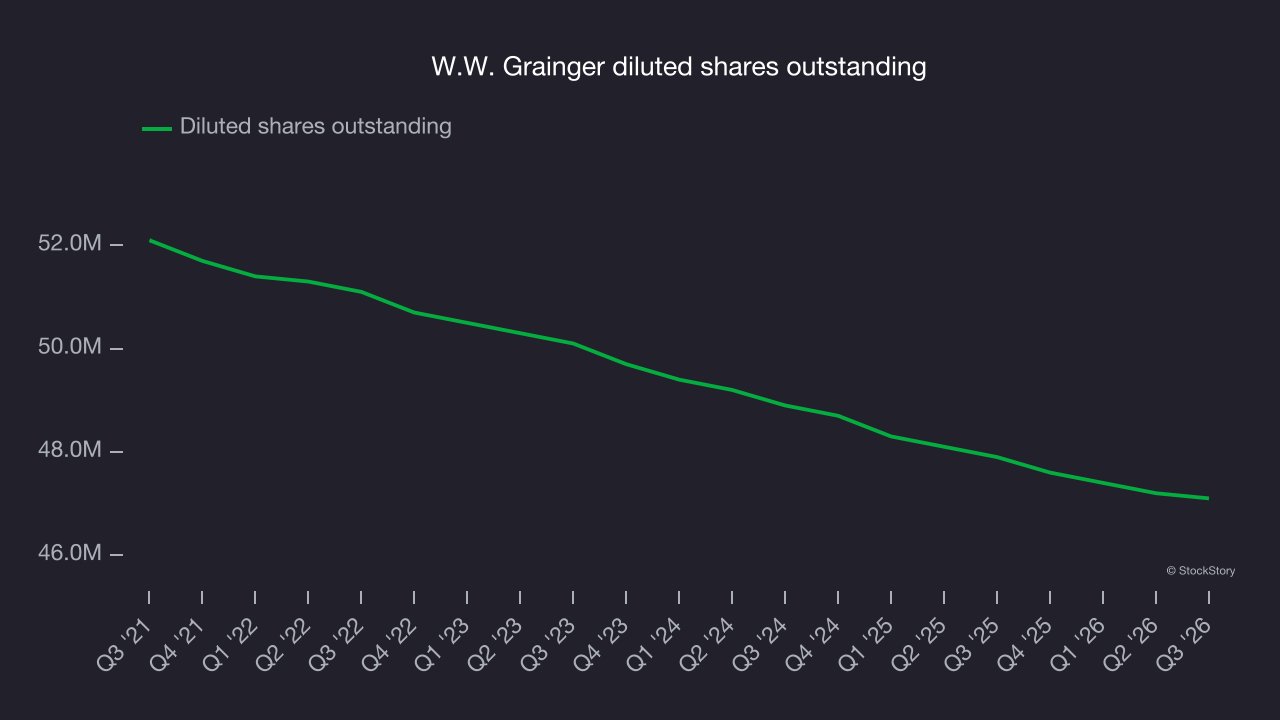
Like with revenue, we analyze EPS over a shorter period to see if we are missing a change in the business.
For W.W. Grainger, its two-year annual EPS growth of 10.2% was lower than its five-year trend. Growth remained solid, but an acceleration would be welcome.
In Q3, W.W. Grainger reported adjusted EPS of $12.54, up from $10.21 in the same quarter last year. The result beat analysts’ consensus estimates by 7.5%. Over the next 12 months, Wall Street expects W.W. Grainger’s full-year EPS to grow 9.3% from $45.64 to $49.90, according to S&P.
Key takeaways from W.W. Grainger’s Q3 results
An organic revenue beat and full-year EPS guidance above Wall Street’s consensus estimates made this a solid quarter for W.W. Grainger. Organic revenue topped analysts’ consensus expectations for the quarter, and shares edged higher 1.4% to $1,417 immediately after the report.
W.W. Grainger had a good quarter, but that alone doesn’t determine whether to invest. That decision calls for considering its valuation, business quality and latest quarterly results. Read the full research report here (it’s free).