Solar power systems company SolarEdge (NASDAQ: SEDG) met Wall Street’s revenue expectations in Q3 2026, but revenue fell by 4.1% year on year to $326.1 million. On the other hand, next quarter’s revenue guidance of $260 million was less impressive, coming in 18% below analysts’ consensus estimates. Its non-GAAP profit of $0.29 per share was significantly above analysts’ consensus estimates.
For more on SolarEdge, read our full research report, available free.
SolarEdge (SEDG) Q3 2026 highlights:
- Revenue $326.1 million vs S&P analysts’ consensus estimates of $326.7 million (4.1% year-on-year decline, in line)
- Adjusted EPS $0.29 vs S&P analysts’ consensus estimates of $0.04 (significant beat)
- Revenue guidance $260 million at the midpoint for Q4 2026, below analysts’ consensus estimates of $317.2 million
- Operating margin -0.6%, up from -10.3% in the same quarter last year
- Free cash flow margin 2.4%, down from 6.7% in the same quarter last year
- Market capitalization $2.02 billion
“The SolarEdge team delivered third-quarter revenue of $326.1 million, at the midpoint of our guidance, with profitability in line with expectations,” said Shuki Nir, CEO of SolarEdge. “As near-term market uncertainty persists and given reduced revenue expectations for the fourth quarter, we are taking decisive steps to reduce costs, sharpen our focus, and support profitability amid softer demand. At the same time, we believe that our product innovation initiatives, including strong momentum in Nexis and increasing storage adoption, position us to capitalize on a market recovery. In addition, we are accelerating our efforts in the AI data center power infrastructure market, where live demonstrations of our solid-state transformer (SST) technology are generating increasing interest from potential partners and customers.”
Revenue growth
A company’s long-term revenue performance can indicate its overall quality. Even a bad business can perform well for one or two quarters, but a top-tier one grows for years. SolarEdge’s demand was weak over the last five years as its revenue fell at a 5.7% annual rate. This was below our standards and suggests it’s a lower-quality business.
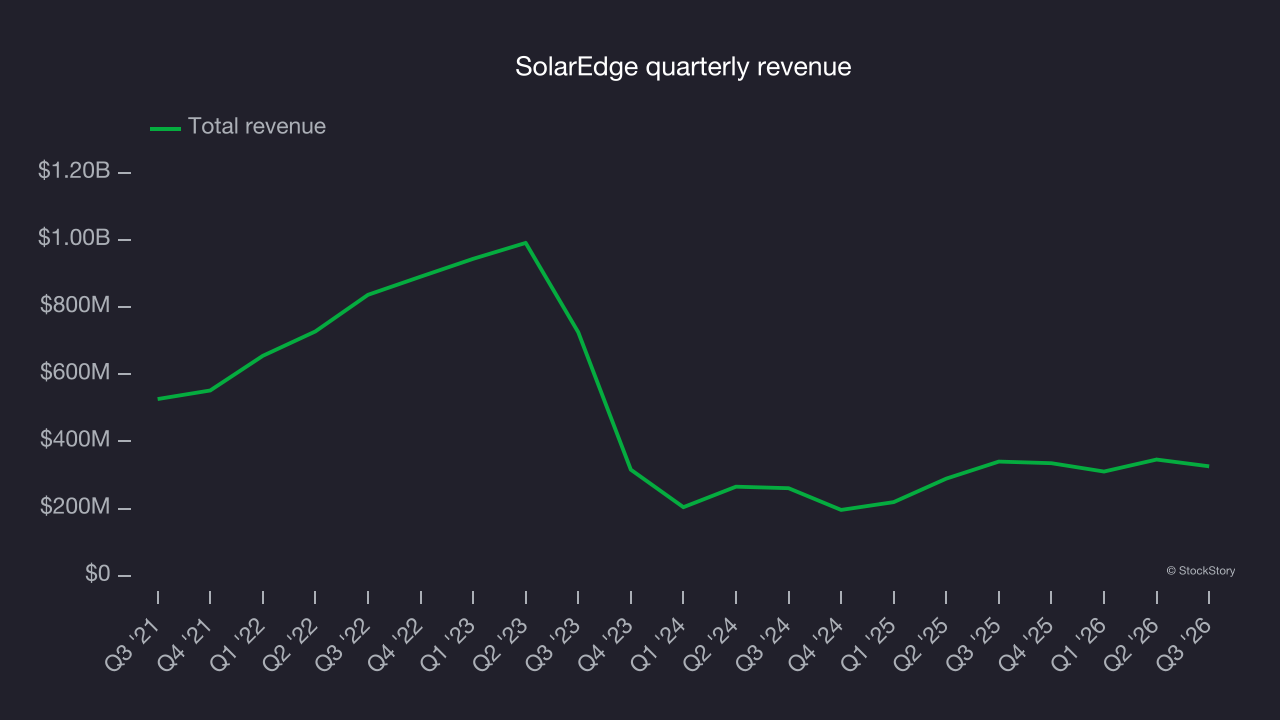
Long-term growth is the most important, but within industrials, a half-decade historical view may miss new industry trends or demand cycles. SolarEdge’s annualized revenue growth of 12.2% over the last two years is above its five-year trend, suggesting its demand recently accelerated. 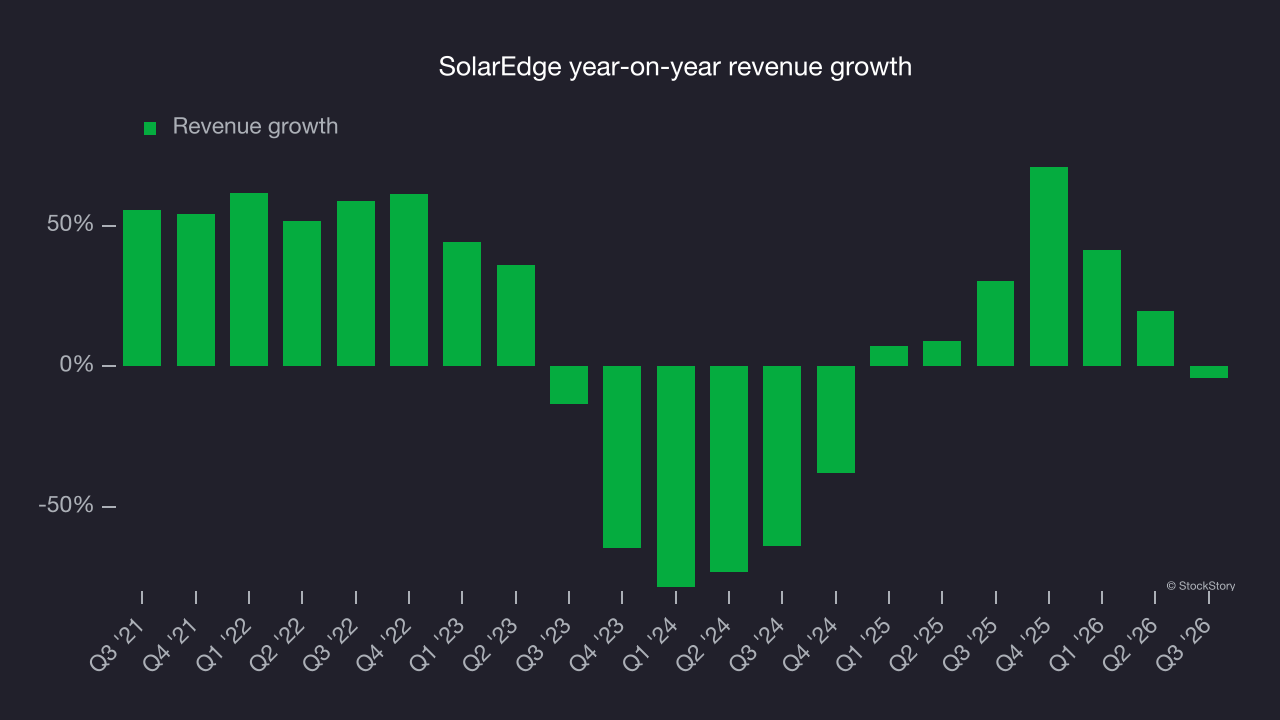
This quarter, SolarEdge reported an uninspiring 4.1% year-on-year revenue decline to $326.1 million, in line with Wall Street’s consensus estimates. Management is guiding for a 22.5% year-on-year decline in revenue next quarter.
Looking further ahead, sell-side analysts expect revenue to grow 3.4% over the next 12 months, according to S&P, a deceleration versus the last two years. This underwhelming projection implies its products and services will see some demand headwinds.
Operating margin
Operating margin is one of the best measures of profitability because it shows how much money a company retains after procuring and manufacturing its products, marketing and selling those products and, most importantly, keeping them relevant through research and development.
Although SolarEdge broke even this quarter from an operational perspective, it’s generally struggled over a longer time period. Its expensive cost structure has contributed to an average operating margin of negative 18.9% over the last five years. Unprofitable industrials companies require extra attention because they could be vulnerable in a downturn. That raises doubts about whether the business can endure a full cycle.
SolarEdge’s operating margin decreased by 16.9 percentage points over the last five years. Its performance was poor, indicating that costs were rising and it couldn’t pass them on to customers.
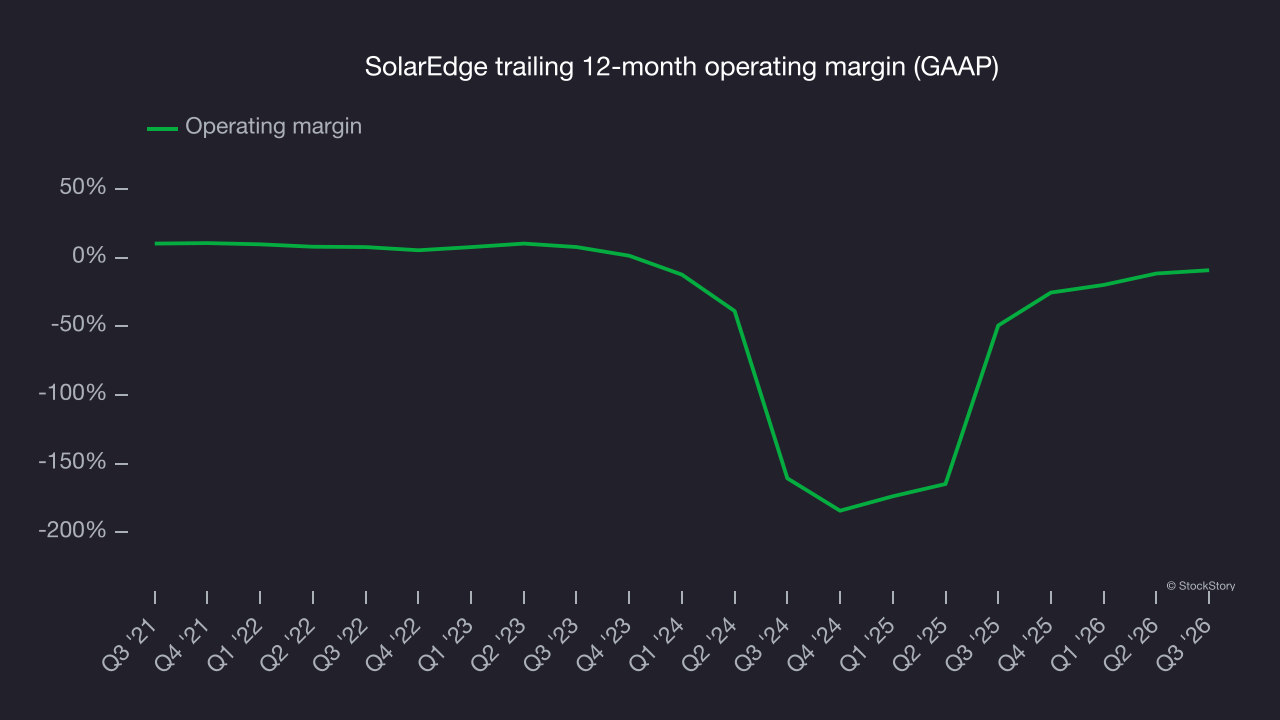
In Q3, SolarEdge generated a negative 0.6% operating margin. The company’s consistent lack of profits raises concerns.
Earnings per share
Long-term changes in earnings per share, or EPS, matter for the same reason as long-term revenue growth. Compared to revenue, however, EPS highlights whether a company’s growth is profitable.
SolarEdge’s EPS declined by 15.4% annually over the last five years, more than its revenue. The company struggled because its fixed cost base made it difficult to adjust to shrinking demand.
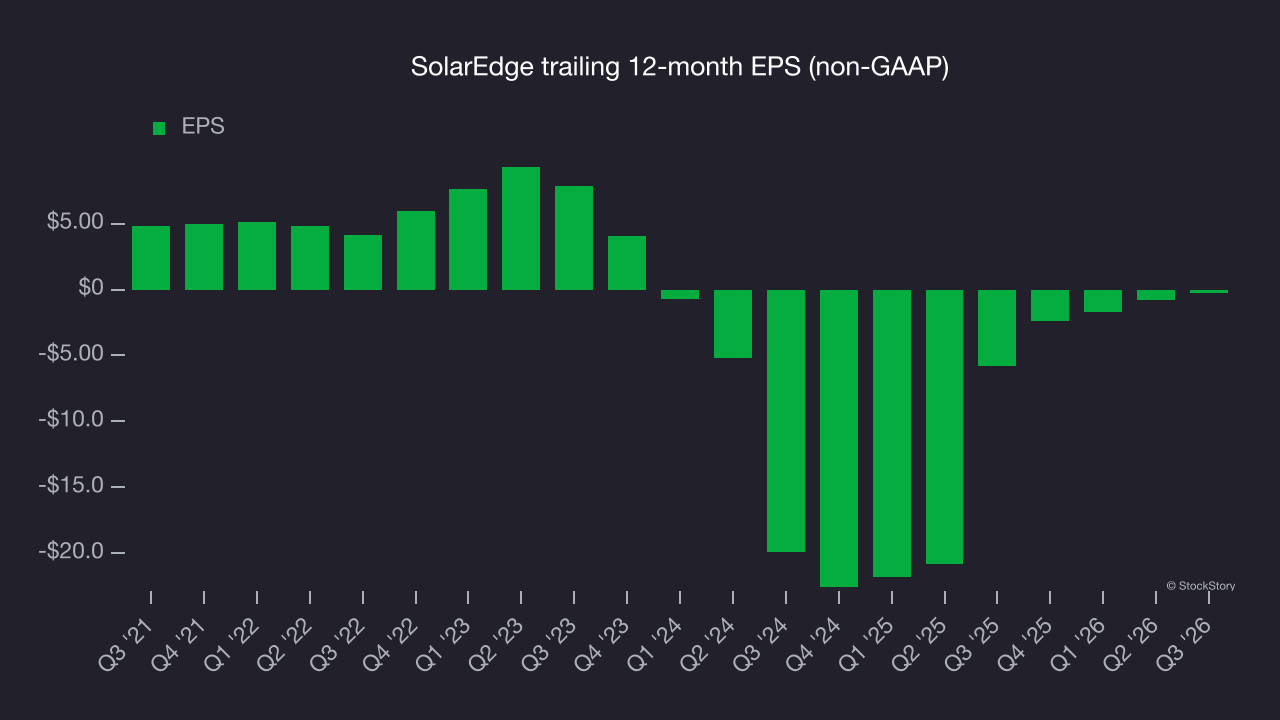
A closer look at SolarEdge’s earnings helps explain its performance. As mentioned earlier, SolarEdge’s operating margin expanded this quarter but declined by 16.9 percentage points over the last five years. Its share count also grew by 10.2%, meaning the company not only became less efficient with its operating expenses but also diluted its shareholders. 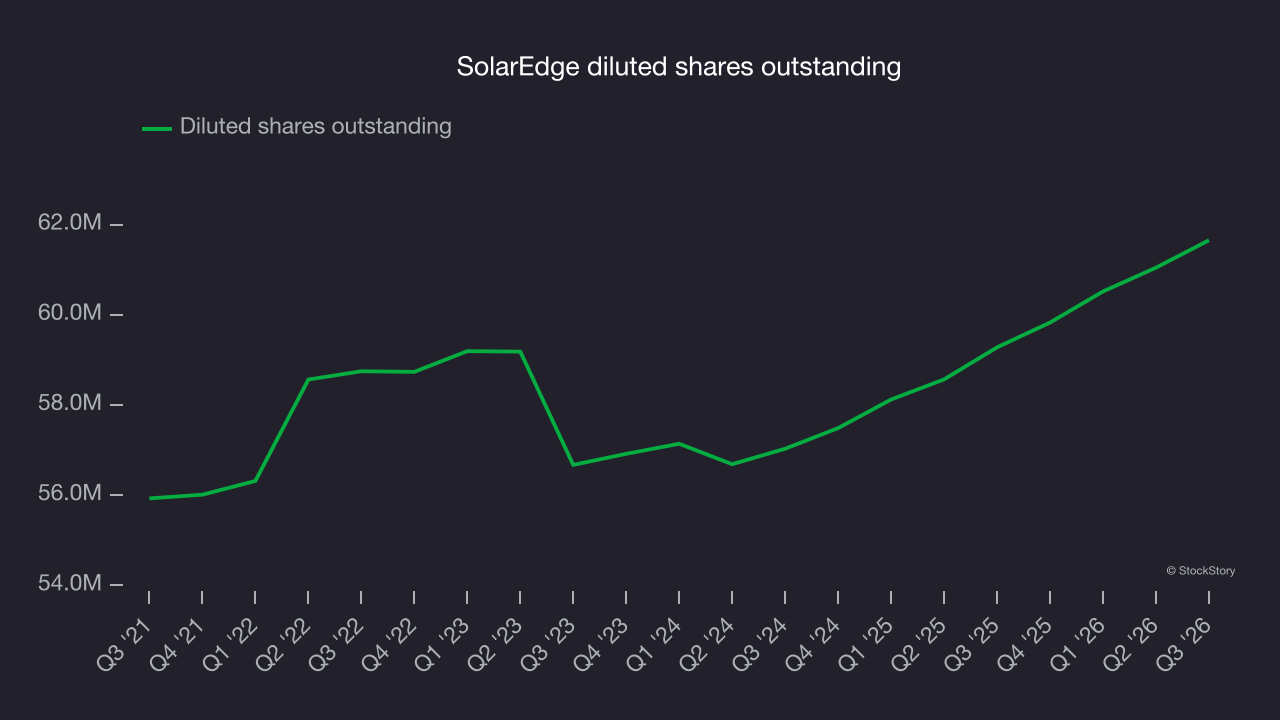
As with revenue, analyzing EPS over a more recent period can provide insight into an emerging theme or development for the business.
For SolarEdge, its two-year annual EPS growth of 89.3% was higher than its five-year trend. Its improving earnings are a positive sign, but a caveat is that its EPS is still in the red.
In Q3, SolarEdge reported adjusted EPS of $0.29, up from negative $0.31 in the same quarter last year. The result was well above analysts’ consensus estimates, a positive outcome for shareholders. Over the next 12 months, analysts forecast SolarEdge’s full-year EPS will turn positive, rising from negative $0.23 to positive $0.41, according to S&P.
Key takeaways from SolarEdge’s Q3 results
SolarEdge’s EPS beat analysts’ consensus estimates, but revenue guidance for next quarter missed expectations, making this a softer quarter overall. Shares tumbled 8.6% to $30.05 immediately after the results.
When considering an investment in SolarEdge, the latest quarter matters, but longer-term business quality and valuation matter more. For more on these factors, read the full research report here (it’s free).