
Intel Corporation (INTC) celebrated the opening of Fab 9, its cutting-edge factory in Rio Rancho, New Mexico on January 24, marking a milestone for high-volume manufacturing of 3D advanced packaging technologies.
This facility, the company's first high-volume semiconductor center, is the sole U.S. factory that fabricates the world's most sophisticated packaging solutions on a large scale. Intel's network of factories worldwide forms a competitive edge, facilitating product enhancement and efficiency.
Turning to its financial performance, Intel surpassed projections for profit and sales during the third quarter despite experiencing a decline in revenue compared to the same period last year.
The firm saw a sales drop of 8%, falling from $15.33 billion in the previous year, marking the seventh quarter in a row that experienced decreasing sales. Intel's net income was recorded at $297 million, or 7 cents per share, a stark contrast to the net income of $1.02 billion, or 25 cents per share, during the same period the prior year.
For the fourth quarter, Intel is projecting earnings of 23 cents per share on revenue between $14.6 billion and $15.6 billion. Meanwhile, market analysts forecast Intel's EPS and revenue will significantly boost to $0.45 and $15.17 billion, respectively in the quarter ended December 2023. However, they are expecting the annual revenue and EPS to settle at $53.98 billion and $0.96, revealing a decrease of 14.4% and 48.1% year-over-year, respectively.
In light of burgeoning competition within the AI chip sector and prevailing macroeconomic uncertainties, it may be prudent to await a more favorable point of entry into the stock. A closer inspection of Intel's key performance indicators could prove insightful.
Analyzing Intel Corporation's Fluctuating Financial Performance (March 2021 - September 2023)
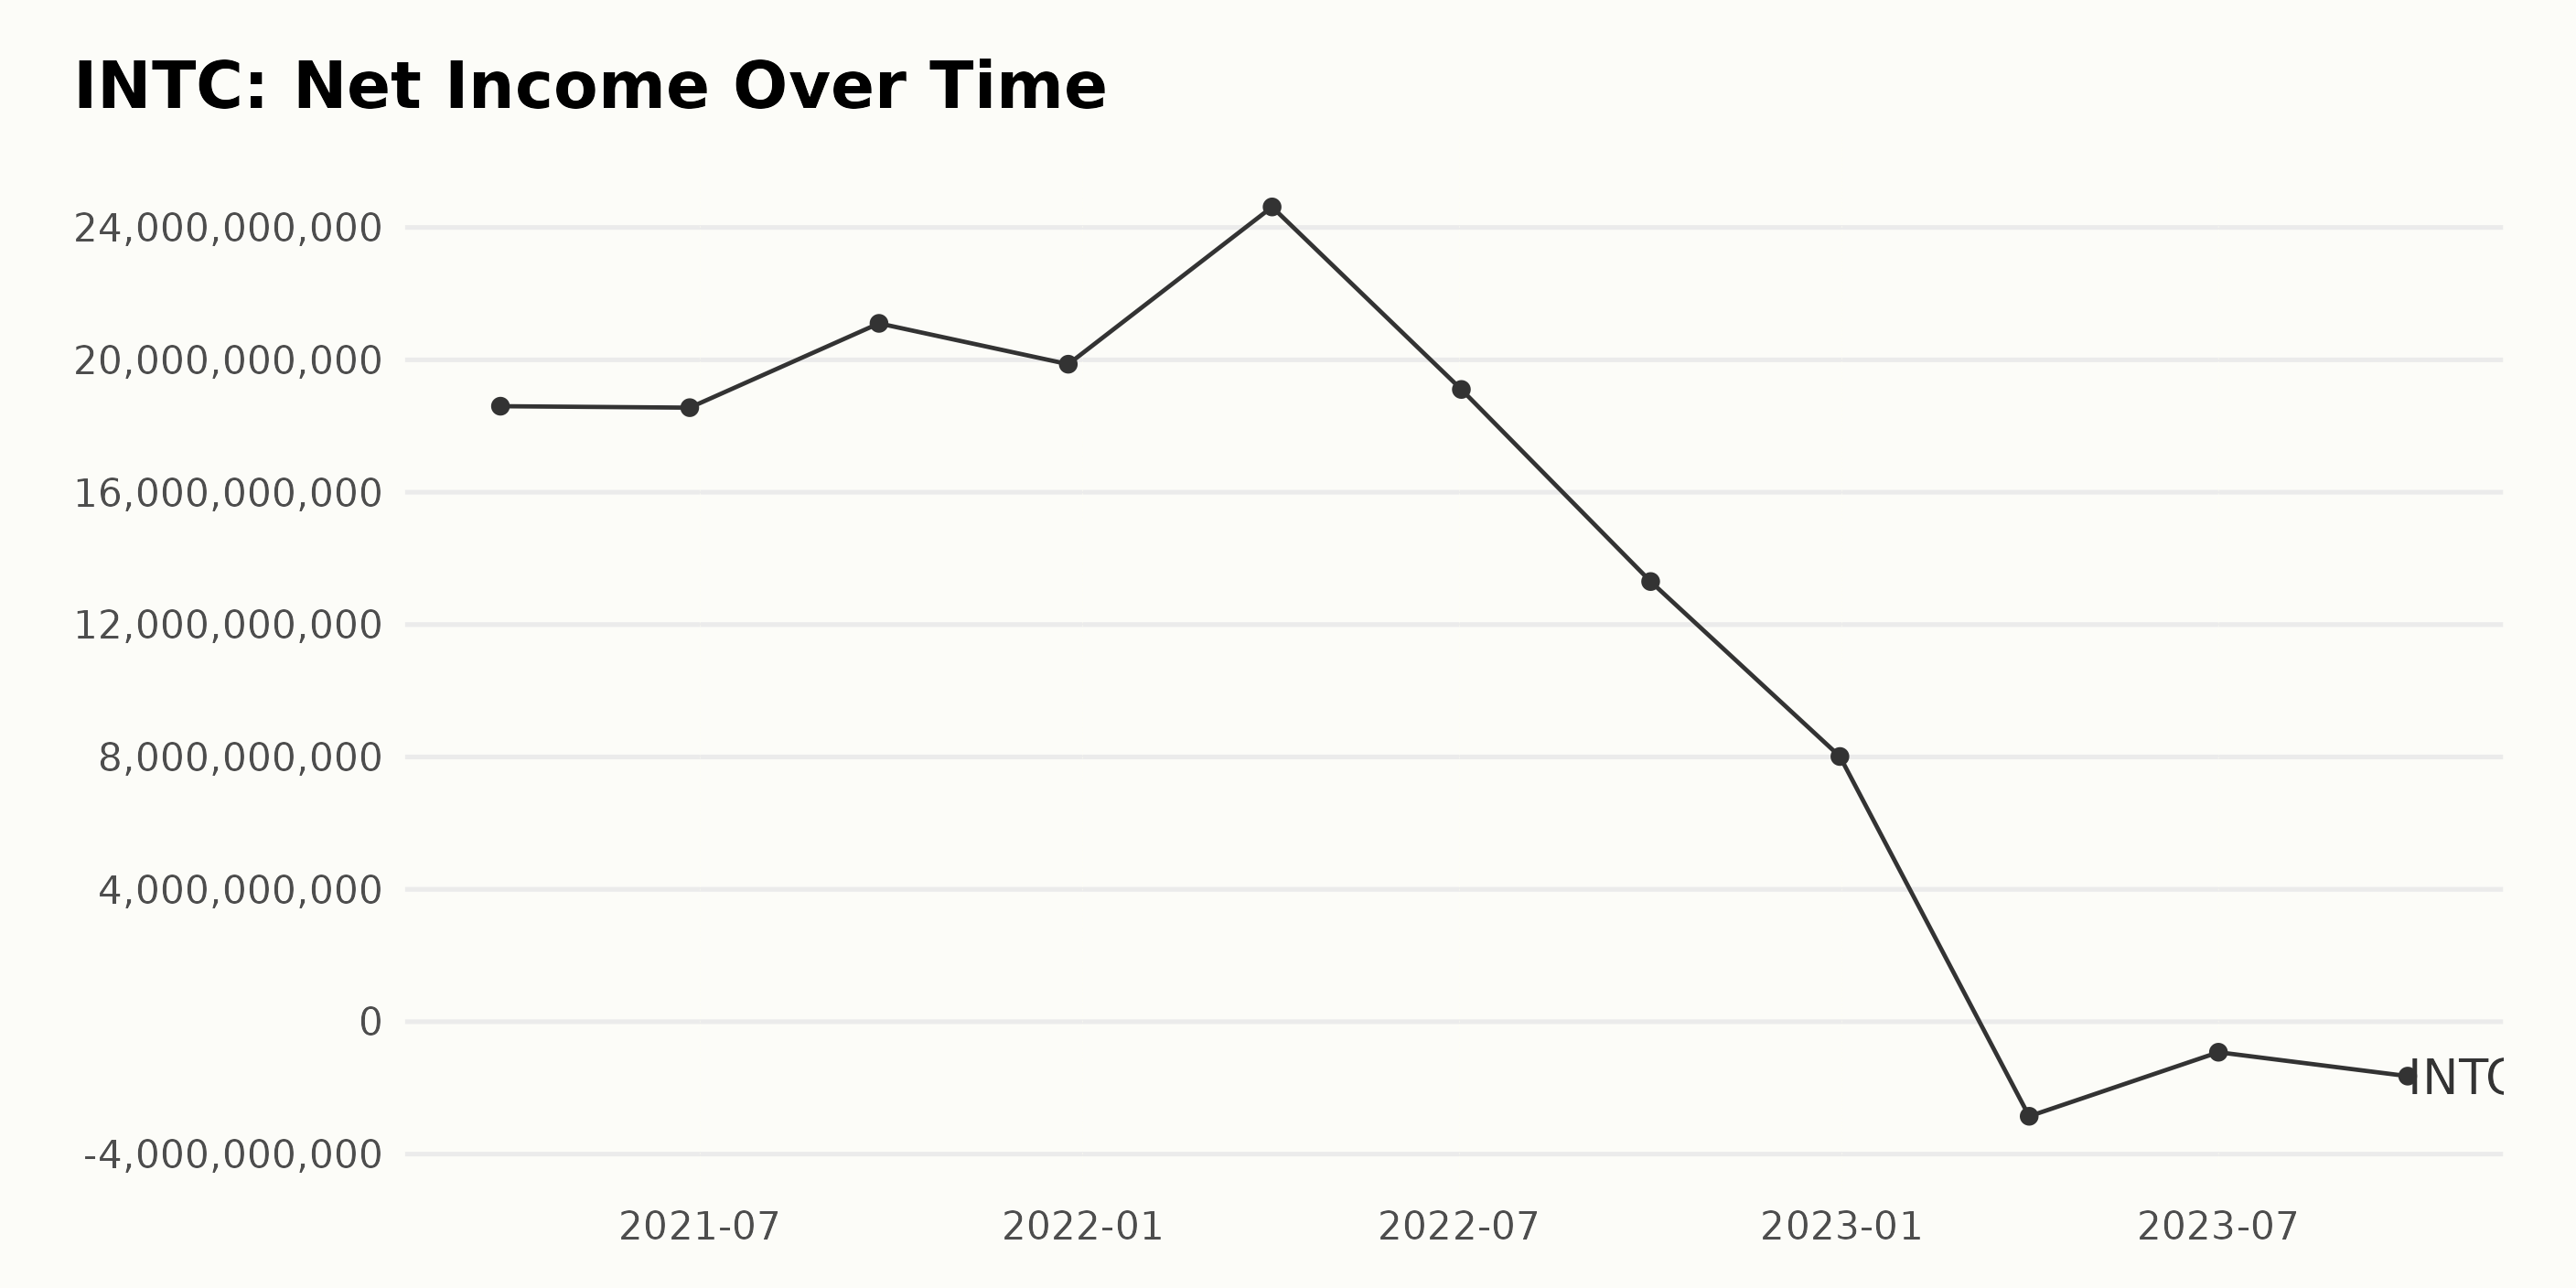
The trailing-12-month Net Income of INTC, shows a fluctuating trend over the period from March 2021 to September 2023.
- In the first quarter 2021 (March 27, 2021), the Net Income was $18.6 billion.
- It slightly decreased in the second quarter, reaching $18.55 billion by June 26, 2021.
- There was a rise to $21.1 billion by September 25, followed by a mild drop to $19.87 billion at the end of the year.
- In 2022, the Net Income notably increased in the second quarter (April 2), elevating to $24.62 billion. But it followed a downward trajectory for the rest of the year, recording $19.11 billion in the third quarter (July 2), and drastically plummeted in the fourth quarter to $13.3 billion and then $8.01 billion on October 1 and December 31 respectively.
- The downward trend of INTC's Net Income persisted into 2023, showing the company incurred losses throughout the year; -$2.86 billion in the first quarter (April 1), -$0.92 billion in second quarter (July 1), and -$1.64 billion by the end of third quarter (September 30).
Regarding growth rate, the decrease in the last value of Net Income from the first value presents a declining trend of -150.18% during the considered period. The more recent data indicates an alarming downward trend with the company experiencing losses in the year 2023.
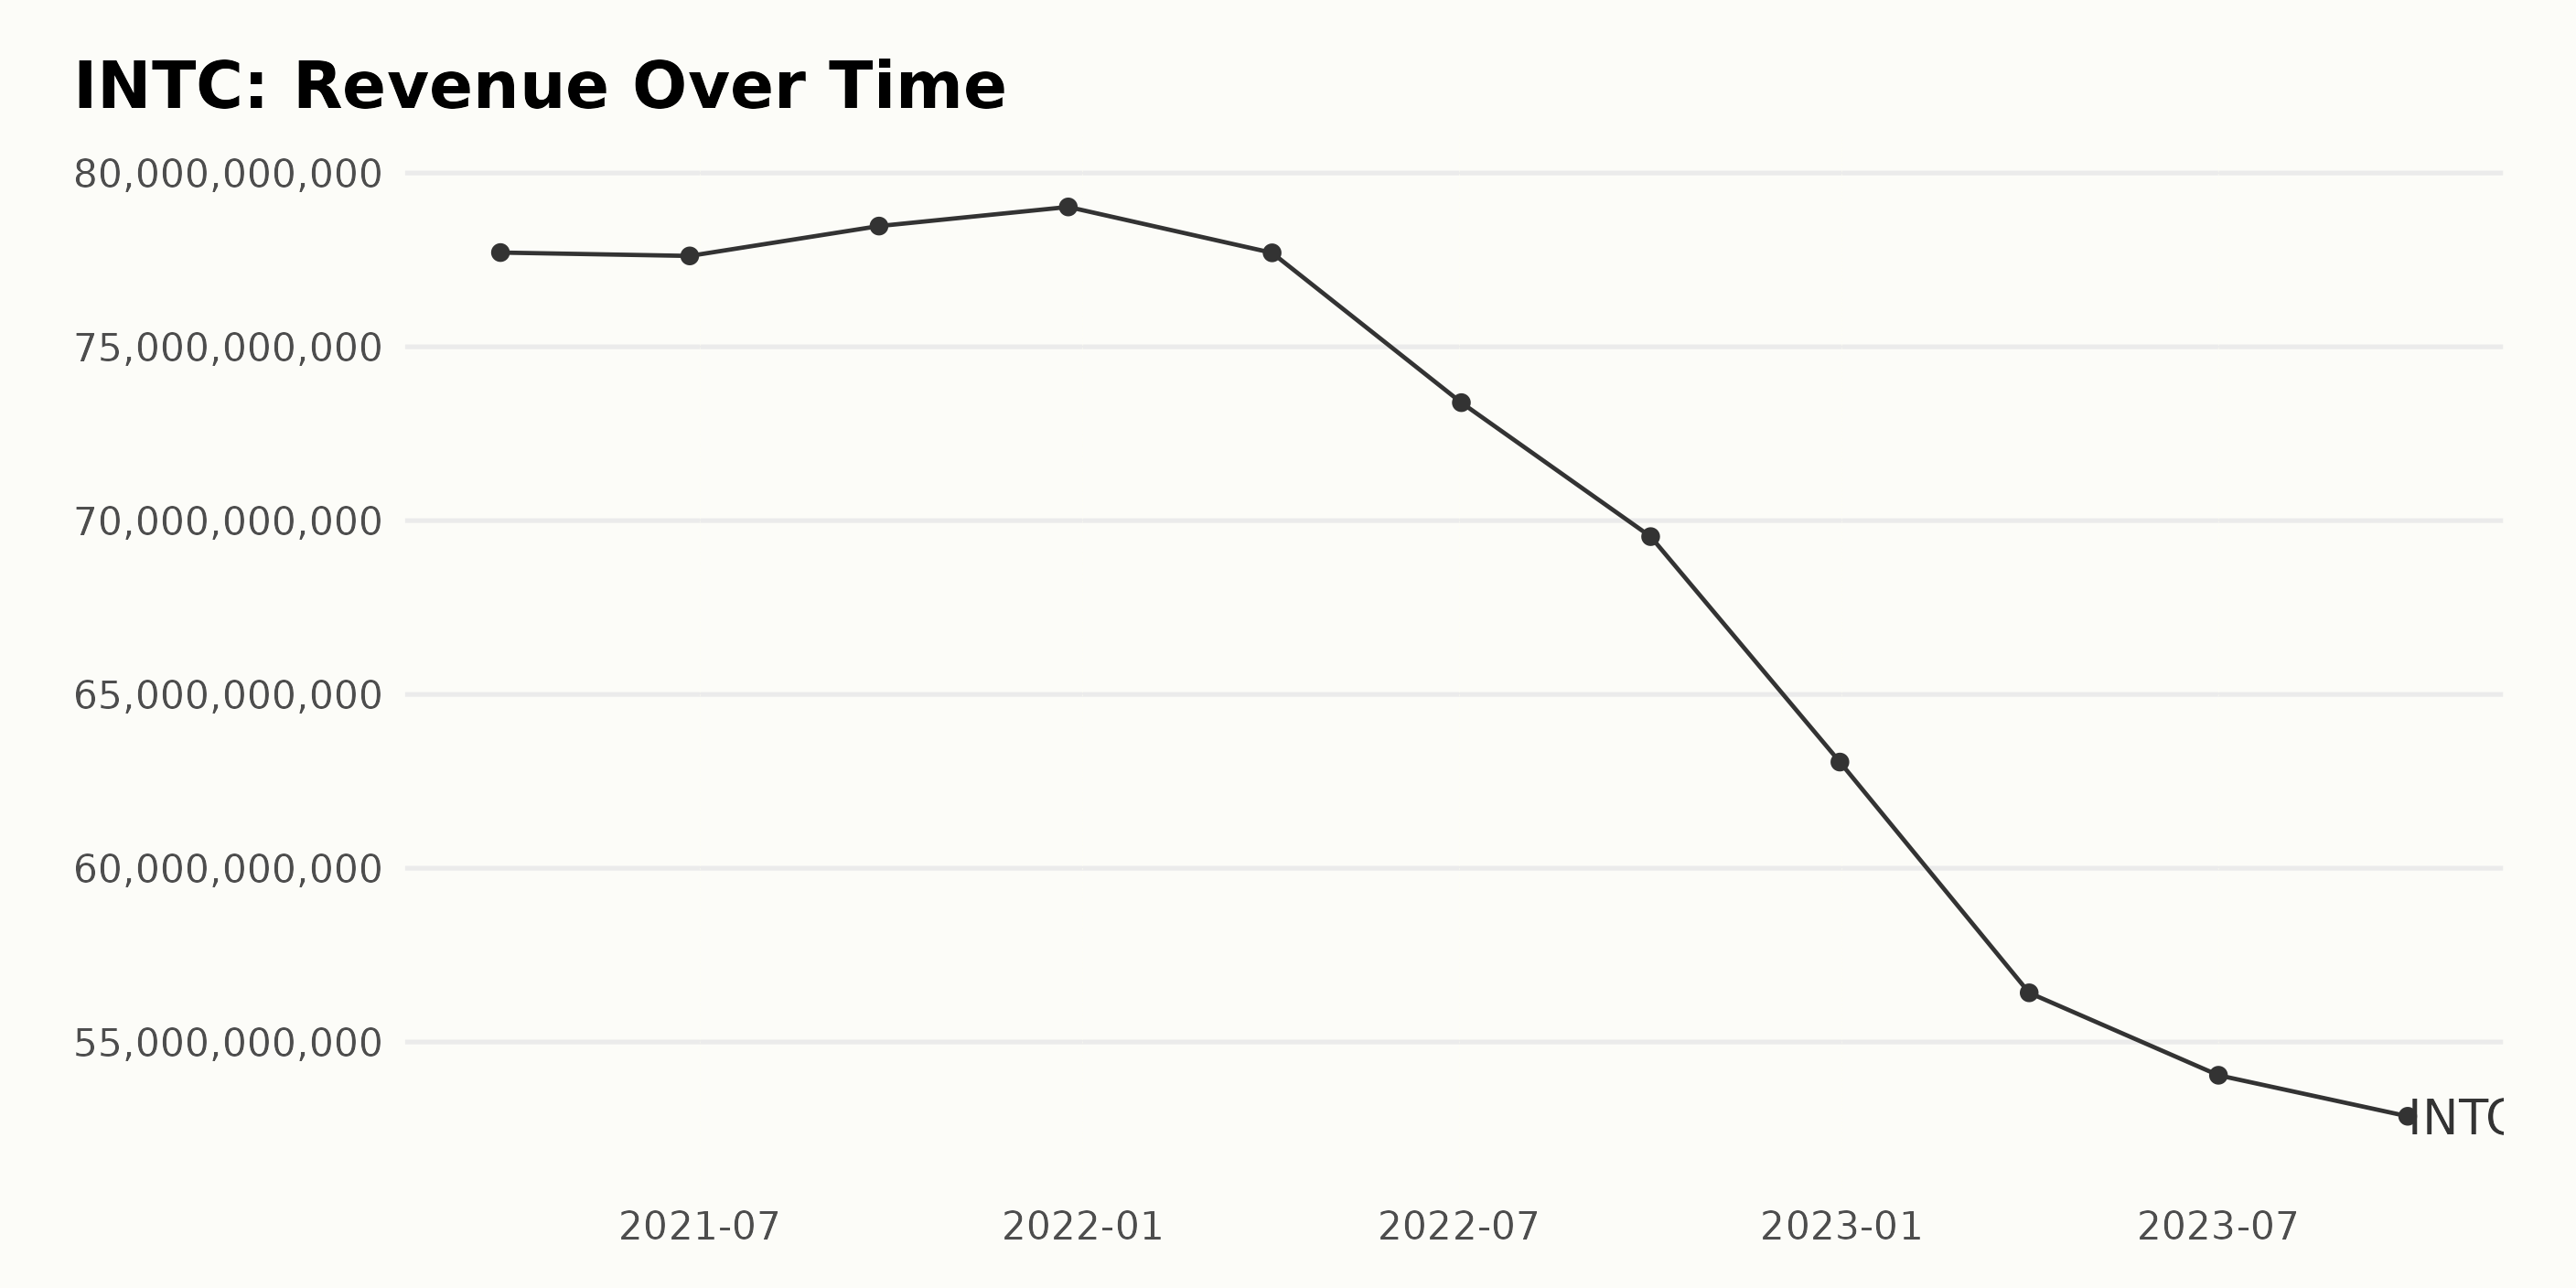
The data series documents the fluctuating trailing-12-month Revenue trends of Intel Corporation (INTC) from March 27, 2021 to September 30, 2023.
- On March 27, 2021, INTC reported a Revenue of $77.71 billion.
- There were slight variations over the subsequent quarters with it reaching $79.02 billion by December 25, 2021.
- However, starting 2022, the trend showed a significant downward tendency. On April 2, 2022, the Revenue decreased slightly to $77.70 billion before experiencing a substantial drop to $63.05 billion by the end of the year.
- The downward trend continued into 2023, with Revenue falling further to $52.86 billion as of September 30, 2023.
The most notable aspect of this dataset is the constant decline in Revenue between the fourth quarter of 2022 and the third quarter of 2023. When comparing the first and last data points (from $77.71 billion in March 2021 to $52.86 billion in September 2023), this signifies a growth rate of -46%, indicating a significant reduction in Revenue over the measured period.
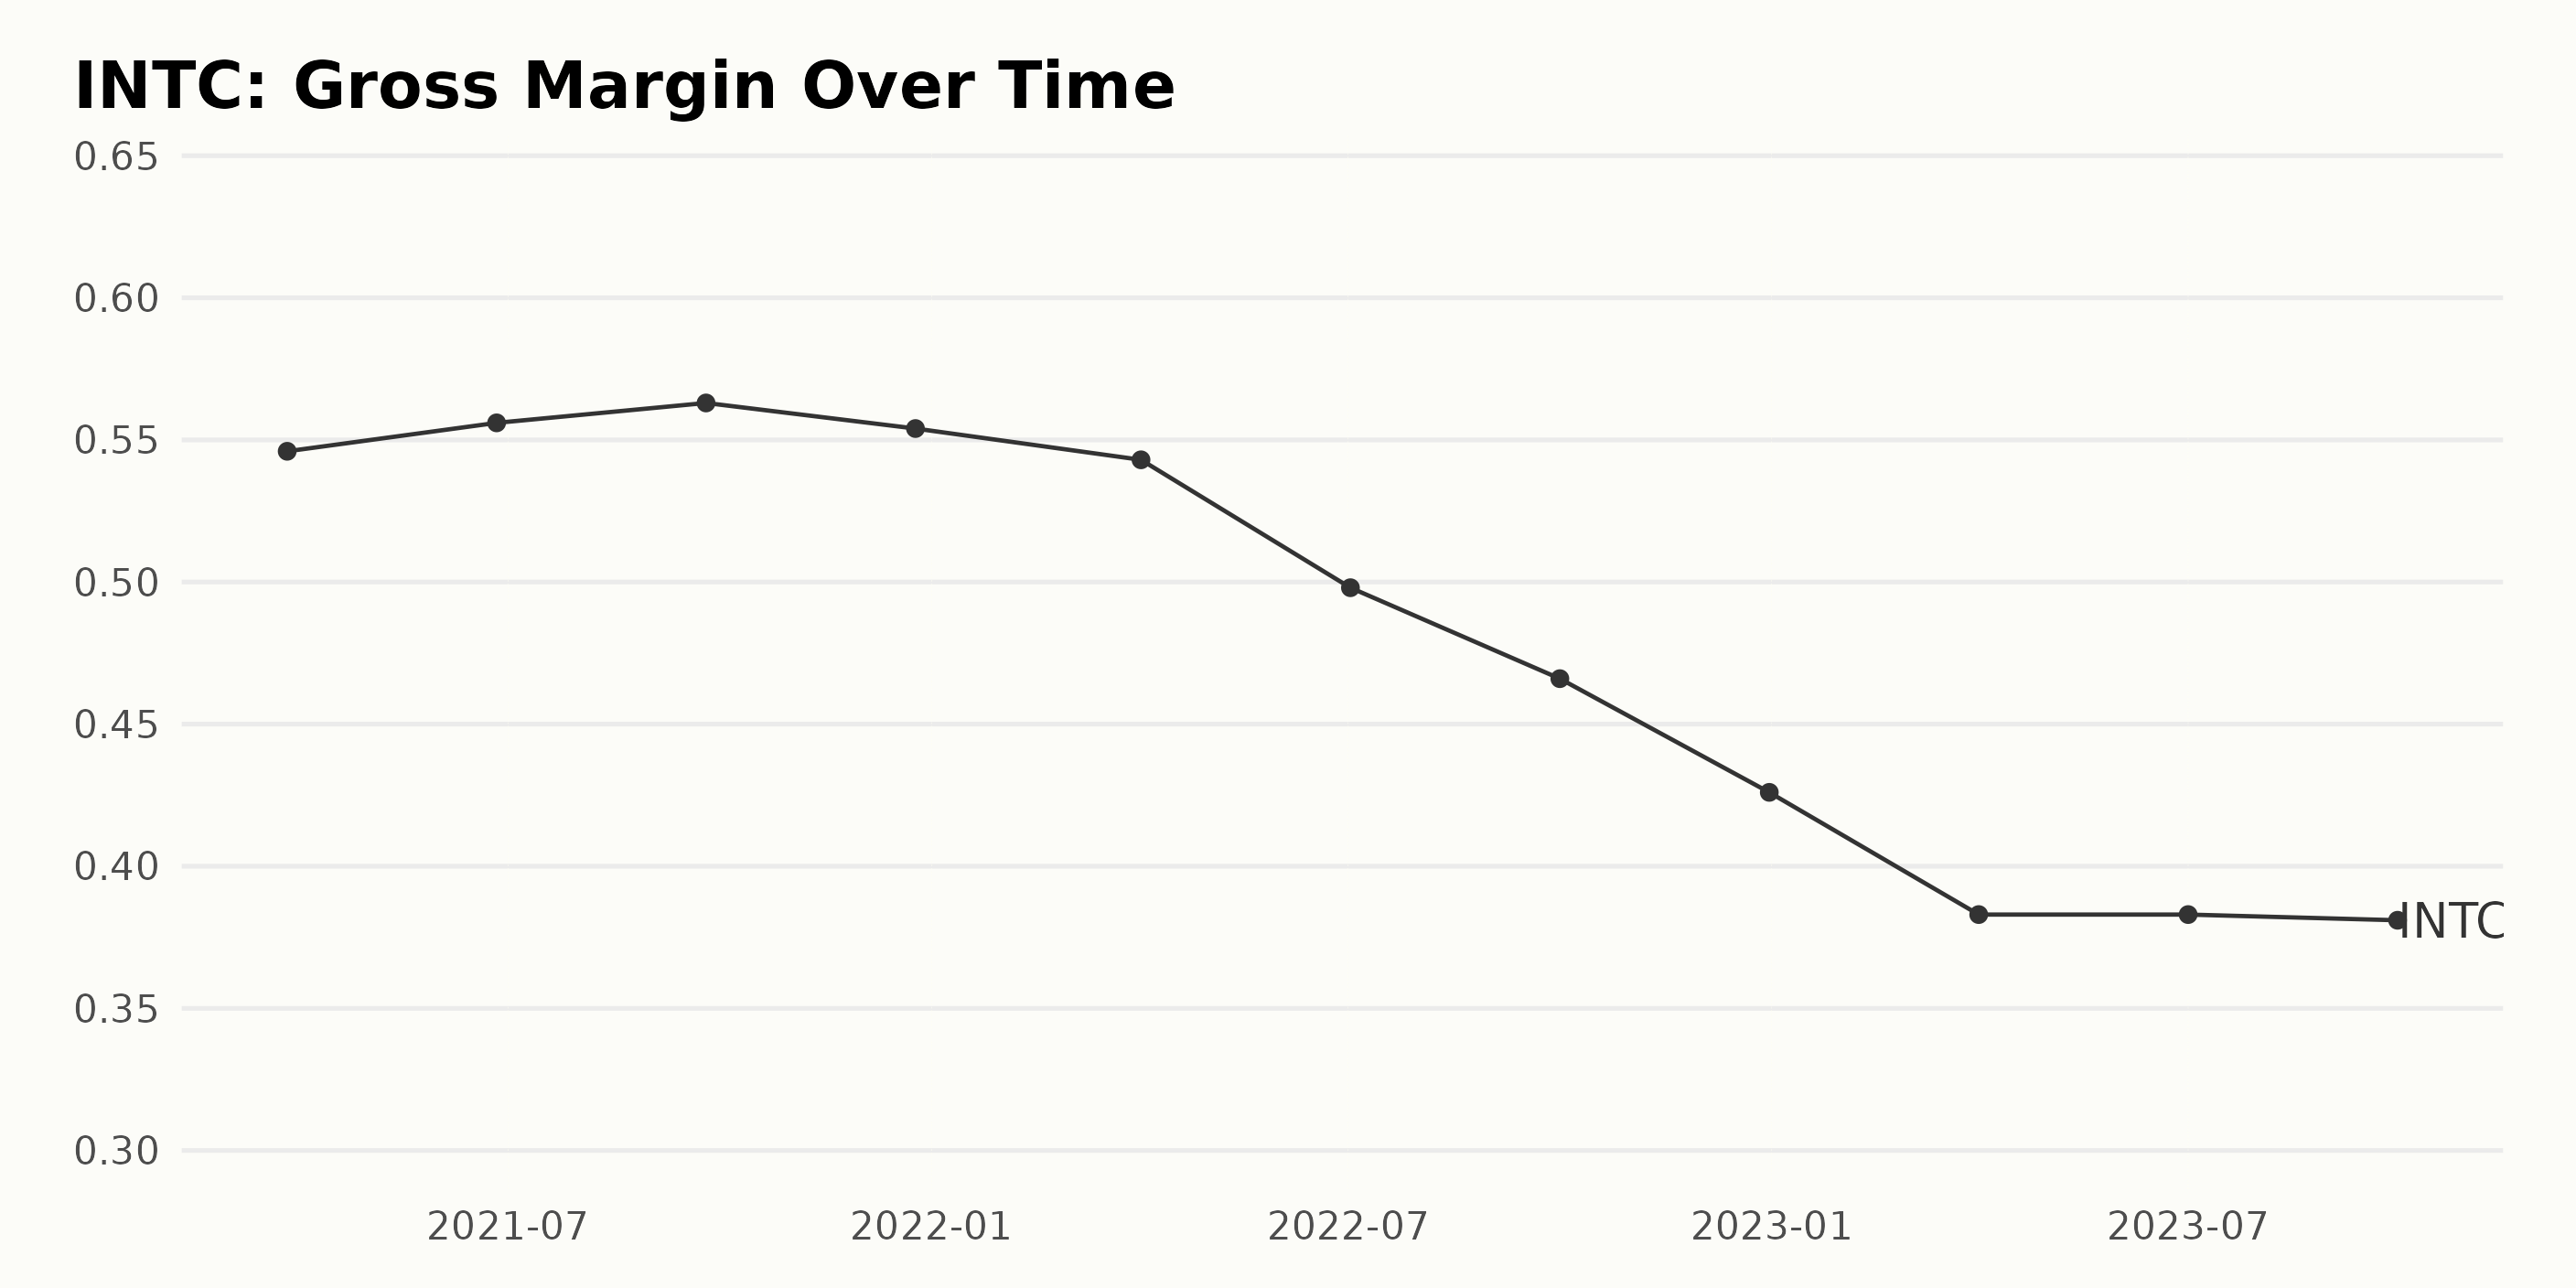
The Gross Margin of Intel Corporation (INTC) demonstrates a number of fluctuations and shows an overall downward trend over the period from March 27, 2021 to September 30, 2023. It's worth reviewing this series of percentages:
- In March 2021, the Gross Margin stood at 54.6%.
- There was a small increase in the following quarter, reaching 55.6% by June 2021.
- By September 2021, the margin had increased slightly again to 56.3%, presenting the highest figure in the series.
- The last quarter of 2021 recorded a slight decrease to 55.4% in December.
- A more noticeable drop occurred in 2022, with the Gross Margin rating lower at 54.3% by April and just 49.8% by July.
- The declining trend continued into October, where the margin slipped further to 46.6%.
- By the end of 2022, the Gross Margin had dipped significantly to 42.6%.
- In 2023, sharp declines continued with the margins standing at 38.3% in both April and July.
- The data series ends with the Gross Margin at 38.1% in September 2023, the lowest in the period.
The overall growth rate from March 2021 to September 2023 shows a decrease of approximately 16.5 percentage points. Emphasizing recent data, it's evident that the Gross Margin has been experiencing a steady decline over the past year. This suggests challenges for INTC in maintaining its profitability margins.
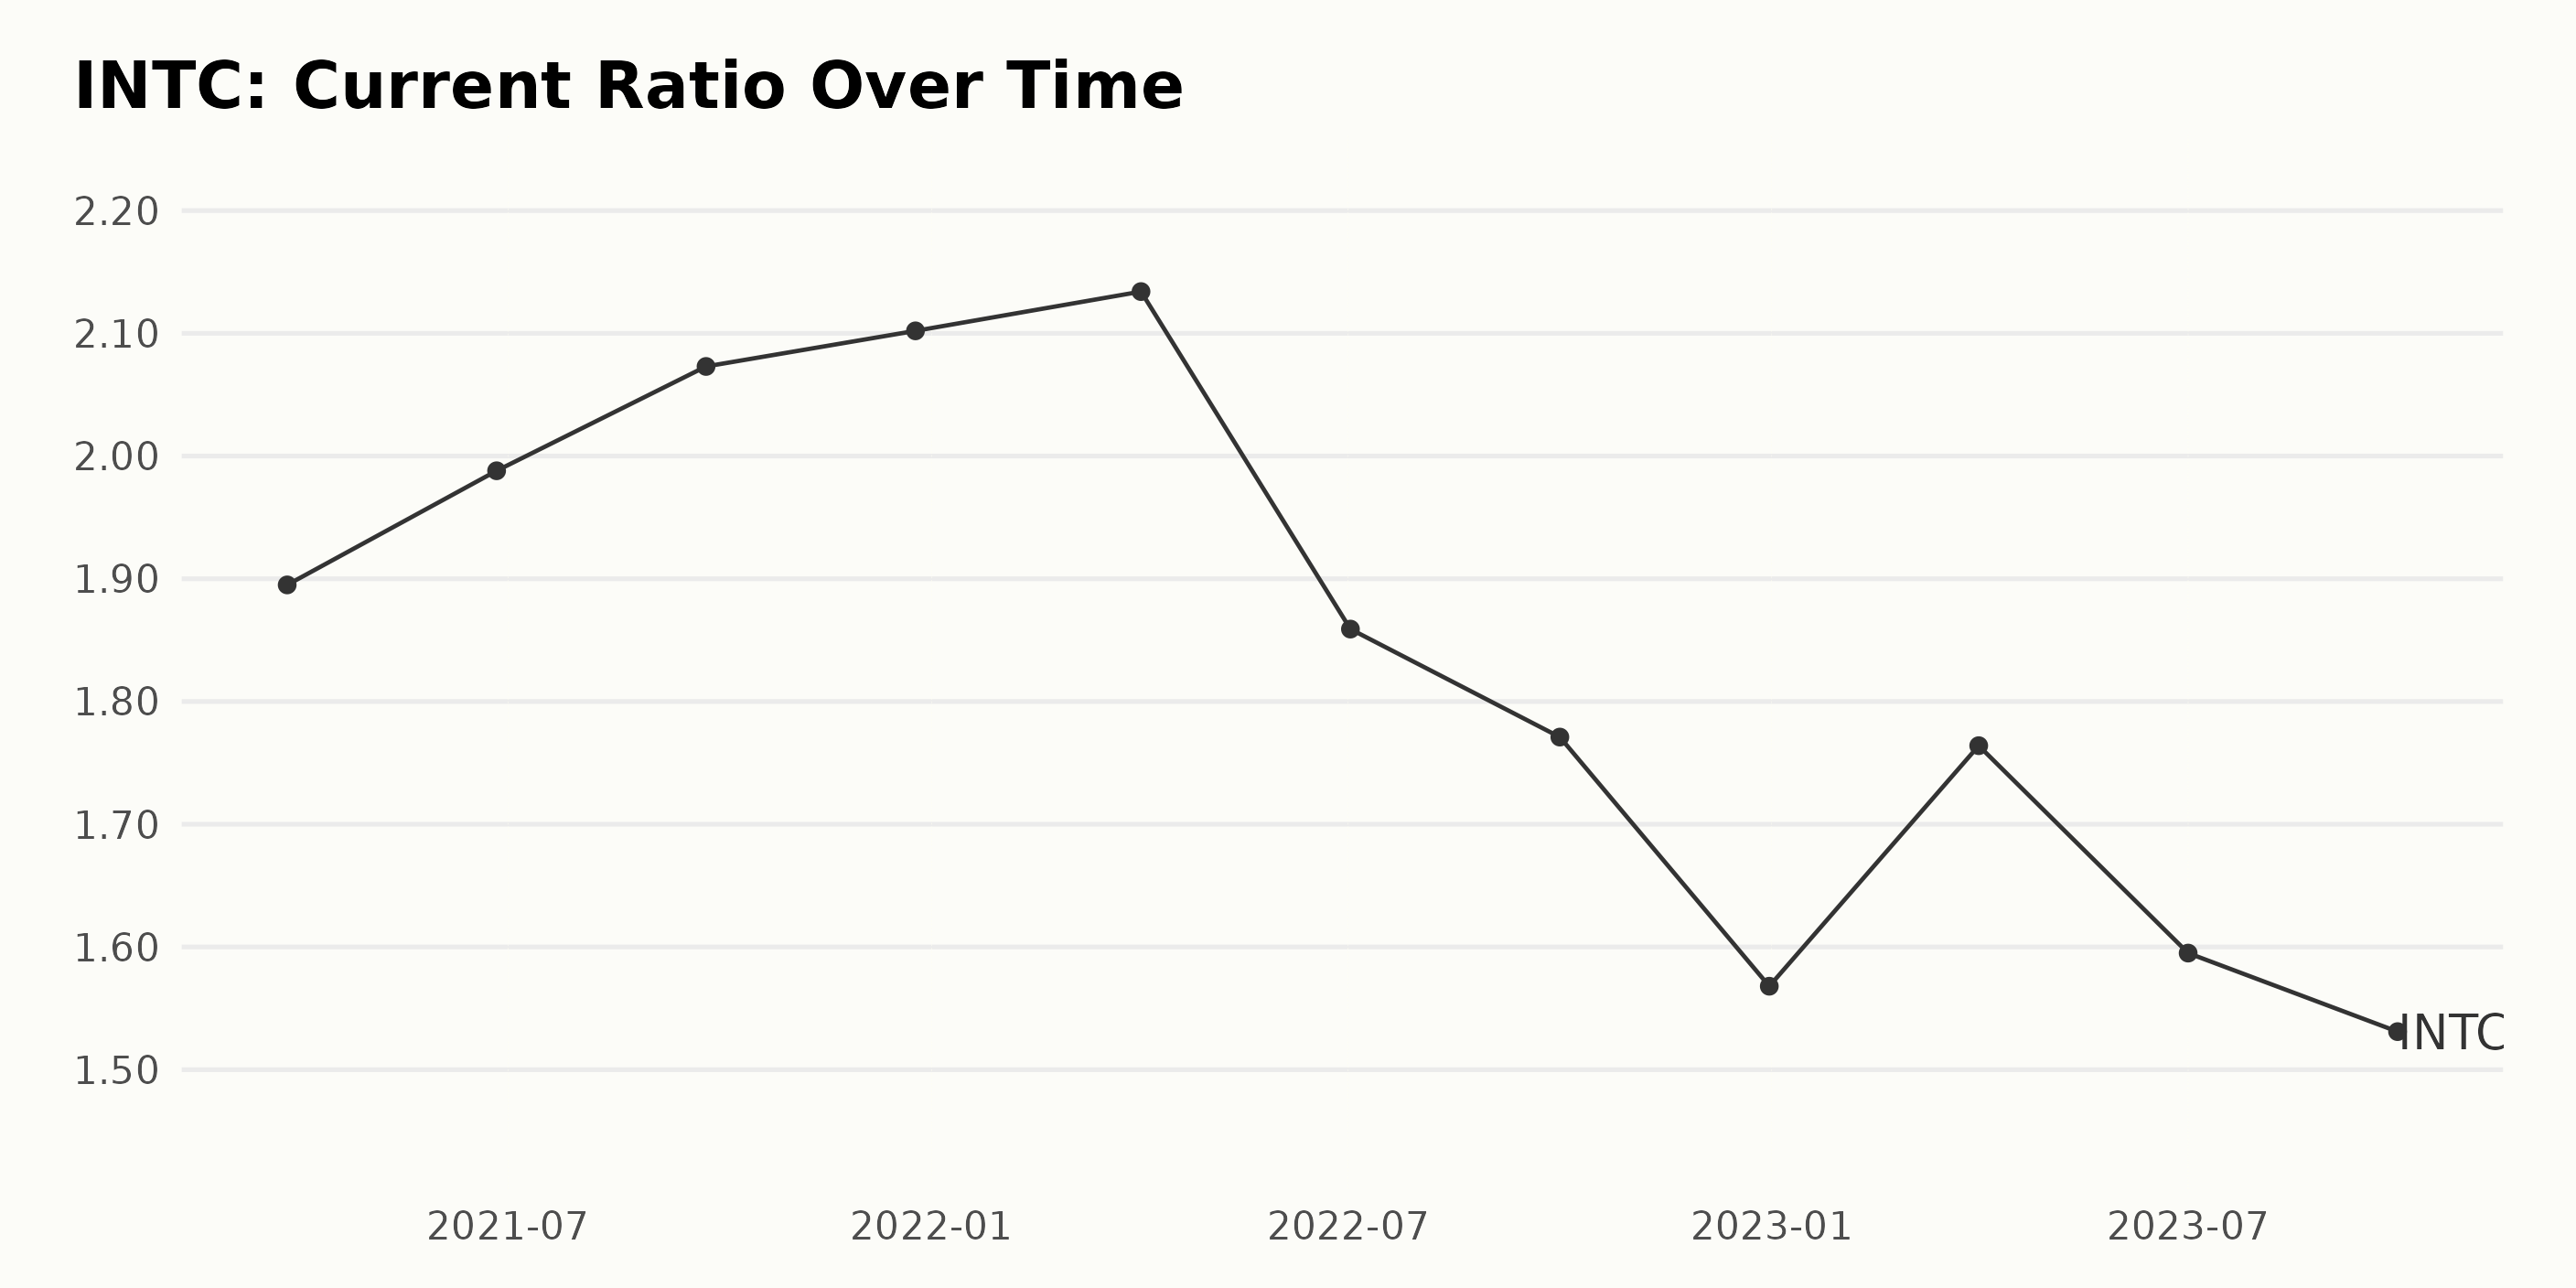
The data presented exhibits the trend and fluctuations in the Current Ratio of Intel Corporation (INTC) from March 27, 2021, to September 30, 2023. The Current Ratio is a measure of the company's financial health, showcasing its ability to cover short-term liabilities with short-term assets. Let's break down this period into significant points:
- On March 27, 2021, INTC had a Current Ratio of 1.90.
- A gradual increase in the Current Ratio was observed through the first four data points, peaking at 2.10 on December 25, 2021.
- A downward trend then emerged starting April 2, 2022, when the Current Ratio fell to 2.13, reaching its lowest at 1.57 by the end of the year on December 31, 2022.
- The Current Ratio subsequently experienced a slight uptick, increasing to 1.76 as of April 1, 2023. However, it then saw another decrease, reporting at 1.53 by the end of the examined period on September 30, 2023.
From the first value (1.90) to the last value in the series (1.53), the Current Ratio decreased by approximately -19.5%, indicating an overall decrease in INTC's short-term liquidity during this period. The fluctuating trend suggests a variable financial condition for the company, with greater emphasis on the recent downward trend, which may indicate challenges in meeting its short-term obligations.
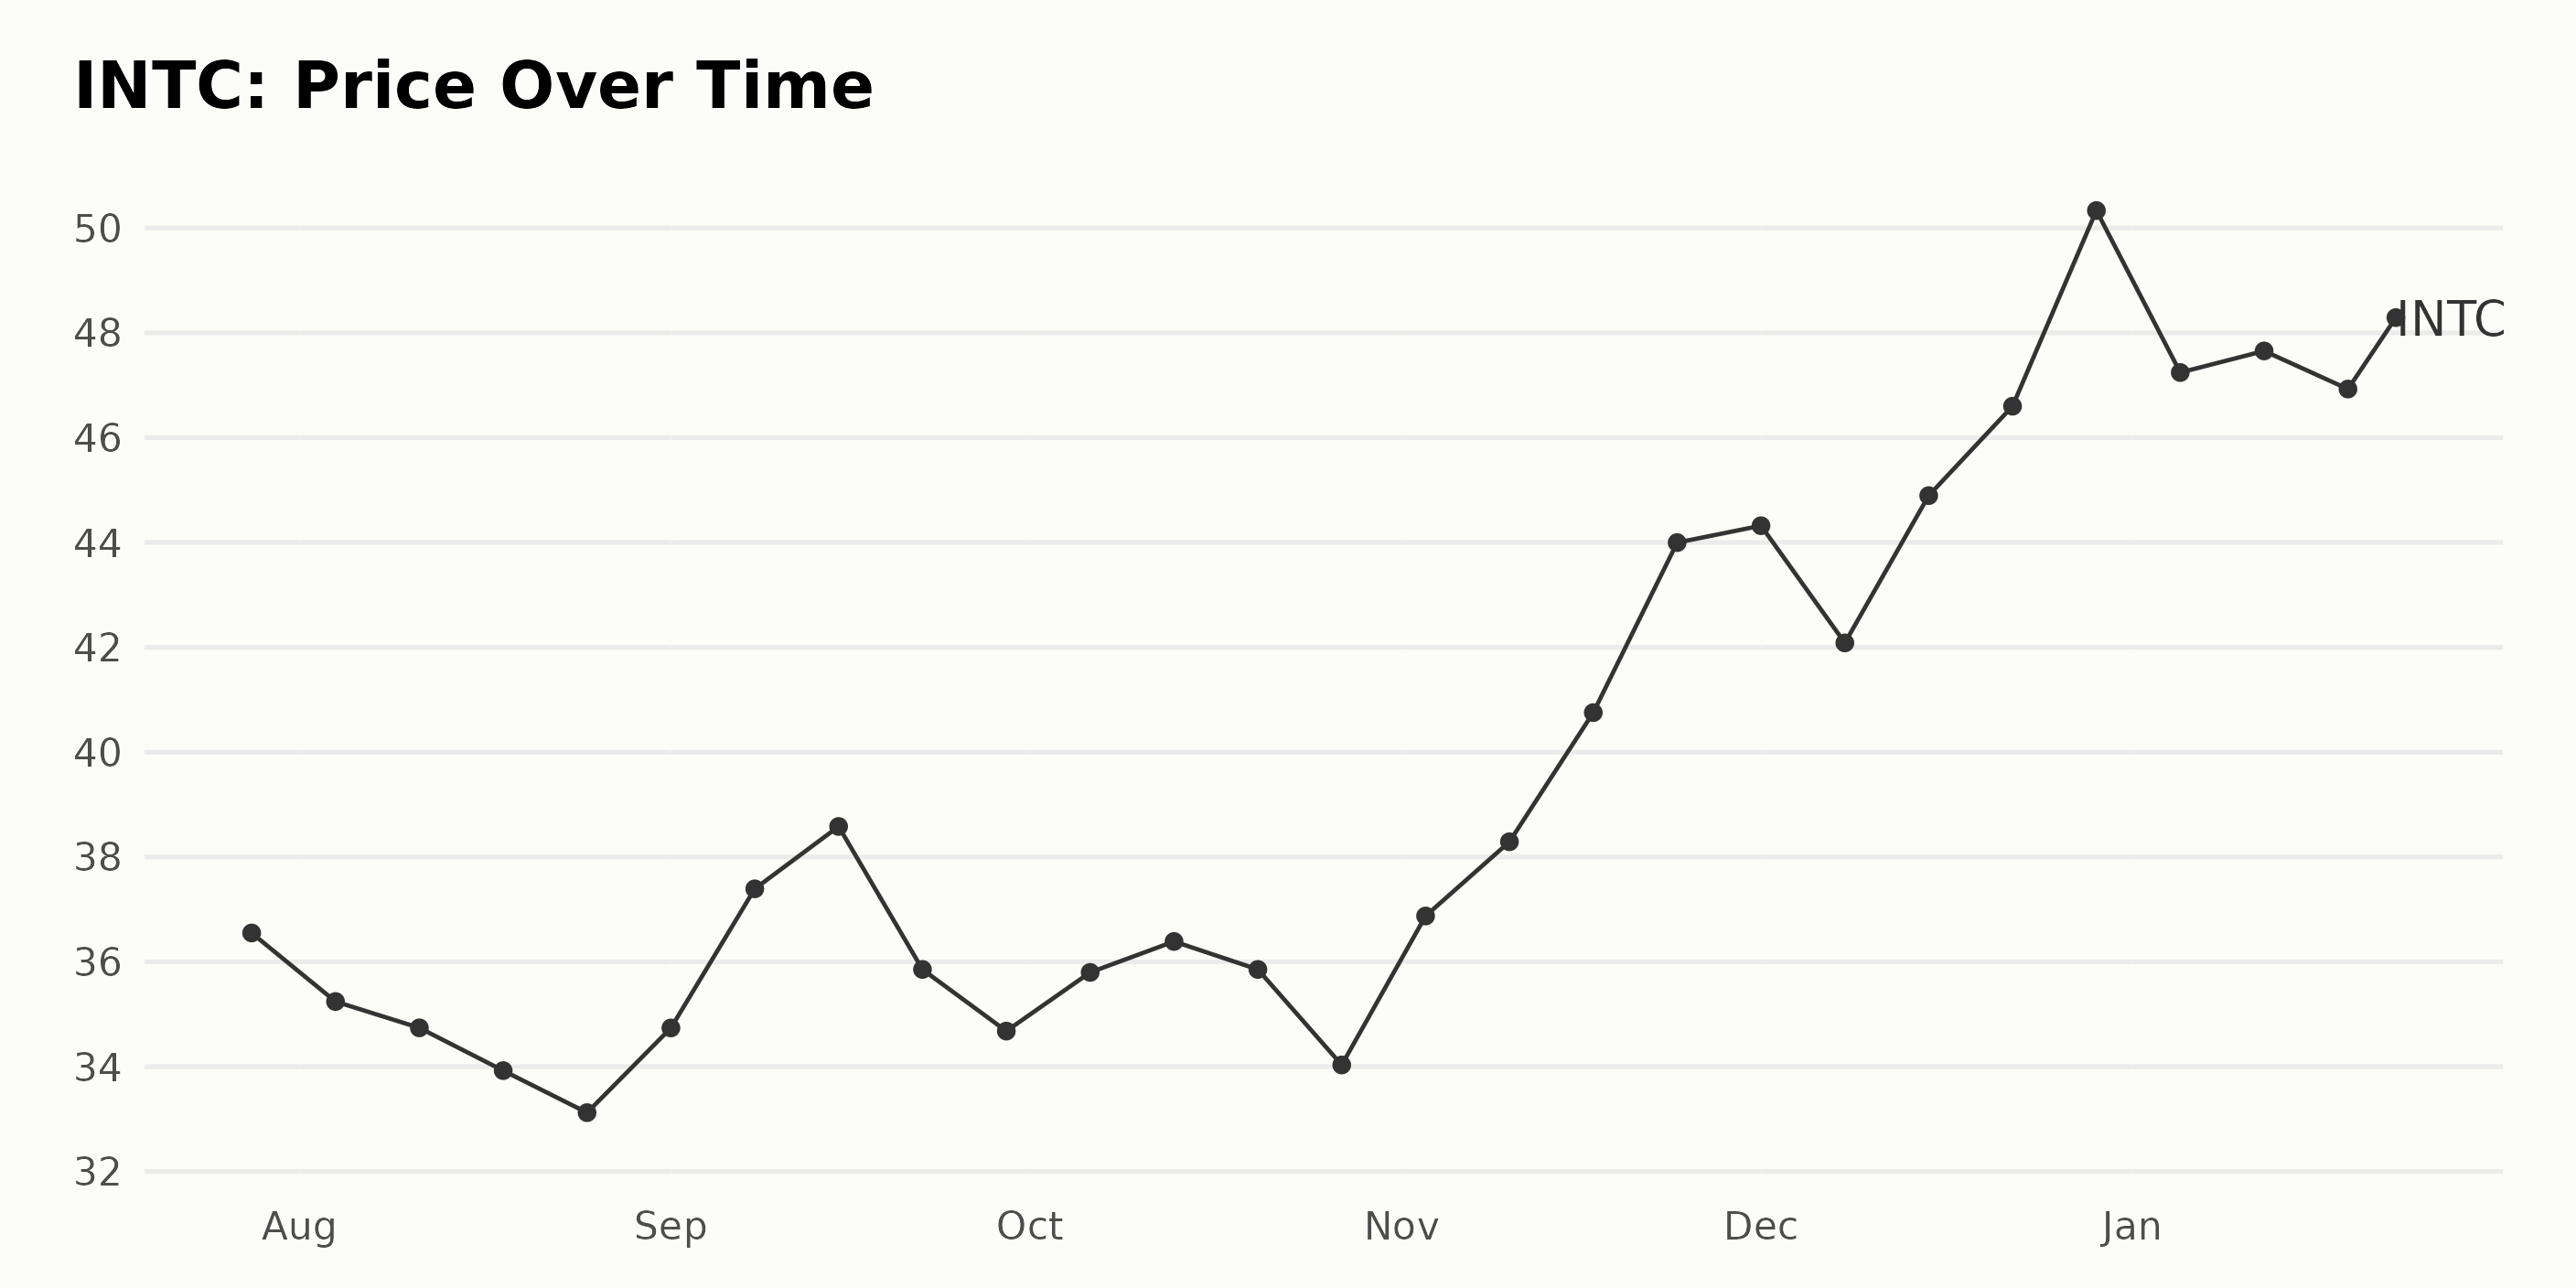
Tracking Intel Corporation's Share Price Fluctuations: July 2023 to January 2024
Based on the given data, the share price of Intel Corporation (INTC) has been exhibiting some significant changes over the period from July 2023 to January 2024. Here is a detailed overview bulleted list:
July 2023 - September 2023: The share price showed a generally decreasing trend, with it starting at $36.55 on July 28, 2023, and dropping to $35.24 by August 4, 2023. The lowest value was recorded in late August at $33.12, but beginning September, the prices start to hike again, reaching a peak by mid-September at $38.58.
September 2023 - October 2023: The rest of September saw a reduction in the share price down to $34.68 by its end. This descending trend continued into October, with small fluctuations in between. A slight increase was seen by October 13, 2023, where it reached up to $36.39, but by October 27, 2023, it fell down to $34.03.
November 2023 - December 2023: Beginning November, the share prices started to ascend prominently. By November 24, 2023, the shares were priced at $44, with a peak price of $50.33 being achieved by December 29, 2023.
January 2024: In the initial weeks of January, the share prices experienced a slight decrease to $46.93 by January 19. However, by January 23, 2024, a rebound ensued, and the share prices rose to $48.29. In summary, the data exhibits an initial downward trend from July 2023 to October 2023, followed by a significant upward trend that continued till the end of December 2023. Afterward, January 2024 saw some fluctuations with general stability towards the end.
The overall growth rate over this period has been positive, showing that Intel Corporation (INTC) experienced an increase in share prices over this timeframe. Here is a chart of INTC's price over the past 180 days.
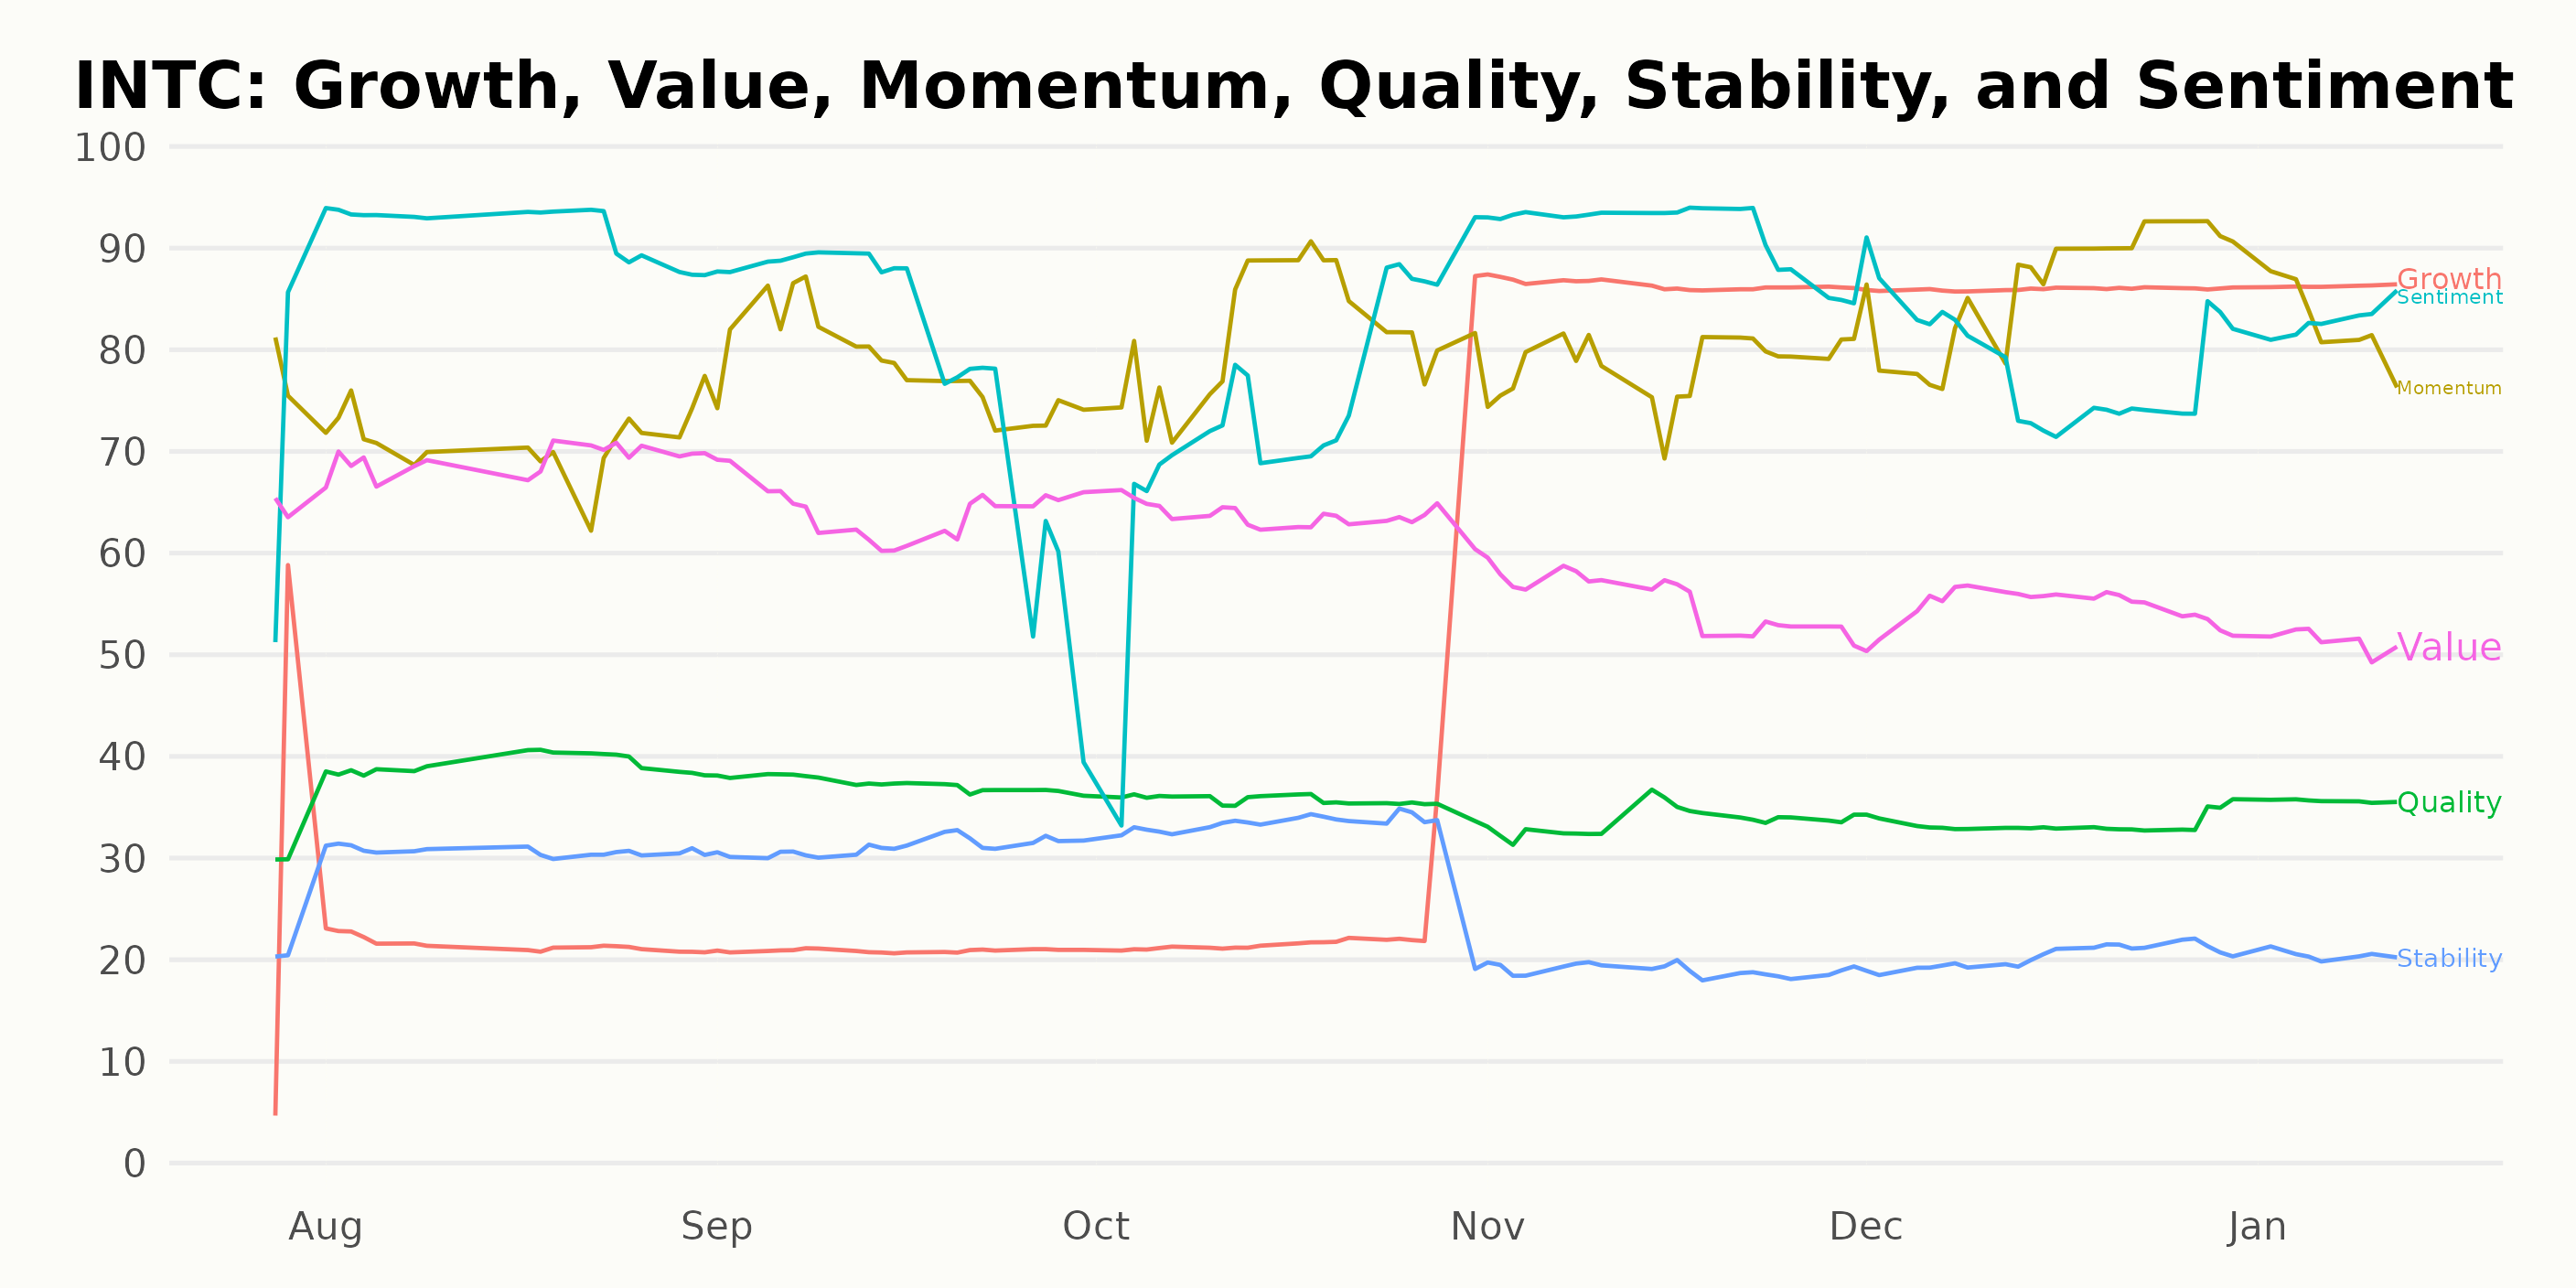
Assessing Intel Corporation's Momentum, Sentiment, and Growth through POWR Ratings
INTC has an overall C rating, translating to a Neutral in our POWR Ratings system. It is ranked #38 out of the 91 stocks in the Semiconductor & Wireless Chip category.
When we examine the data, it becomes apparent that the three most noteworthy POWR Ratings for Intel Corporation (INTC) are momentum, sentiment, and growth.
Momentum
The momentum dimension has consistently received high ratings. This encompasses a significant range from 71 to 87, with its peak observed in December 2023. Notably, its value remains steady at 78 over several periods such as in July, September, November 2023, indicating that INTC is maintaining a strong momentum.
Sentiment
The sentiment shows a strong increase — it rises from 68 in July 2023 to an impressive 92 by August and November of the same year. However, it slightly fluctuates downwards, reaching 79 in December, and then bounces back to 83 in January 2024. This demonstrates a generally high investor sentiment towards INTC.
Growth
Concerning the Growth dimension, a clear positive trend is evident. Beginning at 32 in July 2023, the rating plunges to a low of 21 in August and September. However, this is followed by a remarkable surge to a peak of 86 by November 2023, a rating which is maintained through January 2024. This suggests a solid growth performance and potential for INTC.
How does Intel Corporation (INTC) Stack Up Against its Peers?
Other stocks in the Semiconductor & Wireless Chip sector that may be worth considering are ChipMOS TECHNOLOGIES INC. (IMOS), Infineon Technologies AG (IFNNY), and Renesas Electronics Corporation (RNECF) -- they have better POWR Ratings.
What To Do Next?
43 year investment veteran, Steve Reitmeister, has just released his 2024 market outlook along with trading plan and top 11 picks for the year ahead.
INTC shares were trading at $49.02 per share on Wednesday afternoon, up $0.13 (+0.27%). Year-to-date, INTC has declined -2.45%, versus a 2.47% rise in the benchmark S&P 500 index during the same period.
About the Author: Subhasree Kar

Subhasree’s keen interest in financial instruments led her to pursue a career as an investment analyst. After earning a Master’s degree in Economics, she gained knowledge of equity research and portfolio management at Finlatics.
The post Intel (INTC) Investors Prepare for Earnings Release: Buy or Hold? appeared first on StockNews.com