
Gilead Sciences, Inc. (GILD) is a leading biopharmaceutical company with a significant position in HIV treatment. Its portfolio continues to expand and advance into areas such as viral hepatitis, COVID-19, and oncology.
In recent years, GILD has made 11 strategic acquisitions and entered partnerships focused on innovating its oncology solutions. Consequently, this has both bolstered its commercial offerings and enriched its clinical pipeline. The company’s ambitious vision is to bring more than ten transformative medicines in this area to patients by the end of this decade. Taking into account GILD’s robust product pipeline, the company should see steady growth in its organic revenue in the forthcoming years.
GILD is set to announce its third-quarter results of 2023 on November 7. Given its impressive track record of surpassing analysts’ revenue and earnings estimates, there is a level of optimism surrounding this forthcoming report. Evidence from the last four trailing quarters shows that the company consistently exceeded consensus revenue estimates, and surpassed earnings estimates twice.
Analysts expect a modest year-over-year growth for GILD’s Earnings Per Share (EPS), projecting it at $1.91 for the quarter ended September 2023. Concurrently, its revenue is anticipated to reach $6.79 billion.
Given Gilead’s progressive product pipeline, strategic collaborations, and robust position within the biopharmaceutical industry, the biotech stock certainly seems worth considering for long-term investment. Supporting this bullish view are a number of key financial metrics that underscore the company’s promising position.
Analyzing the Financial Performance of Gilead Sciences Inc. from 2020-2023
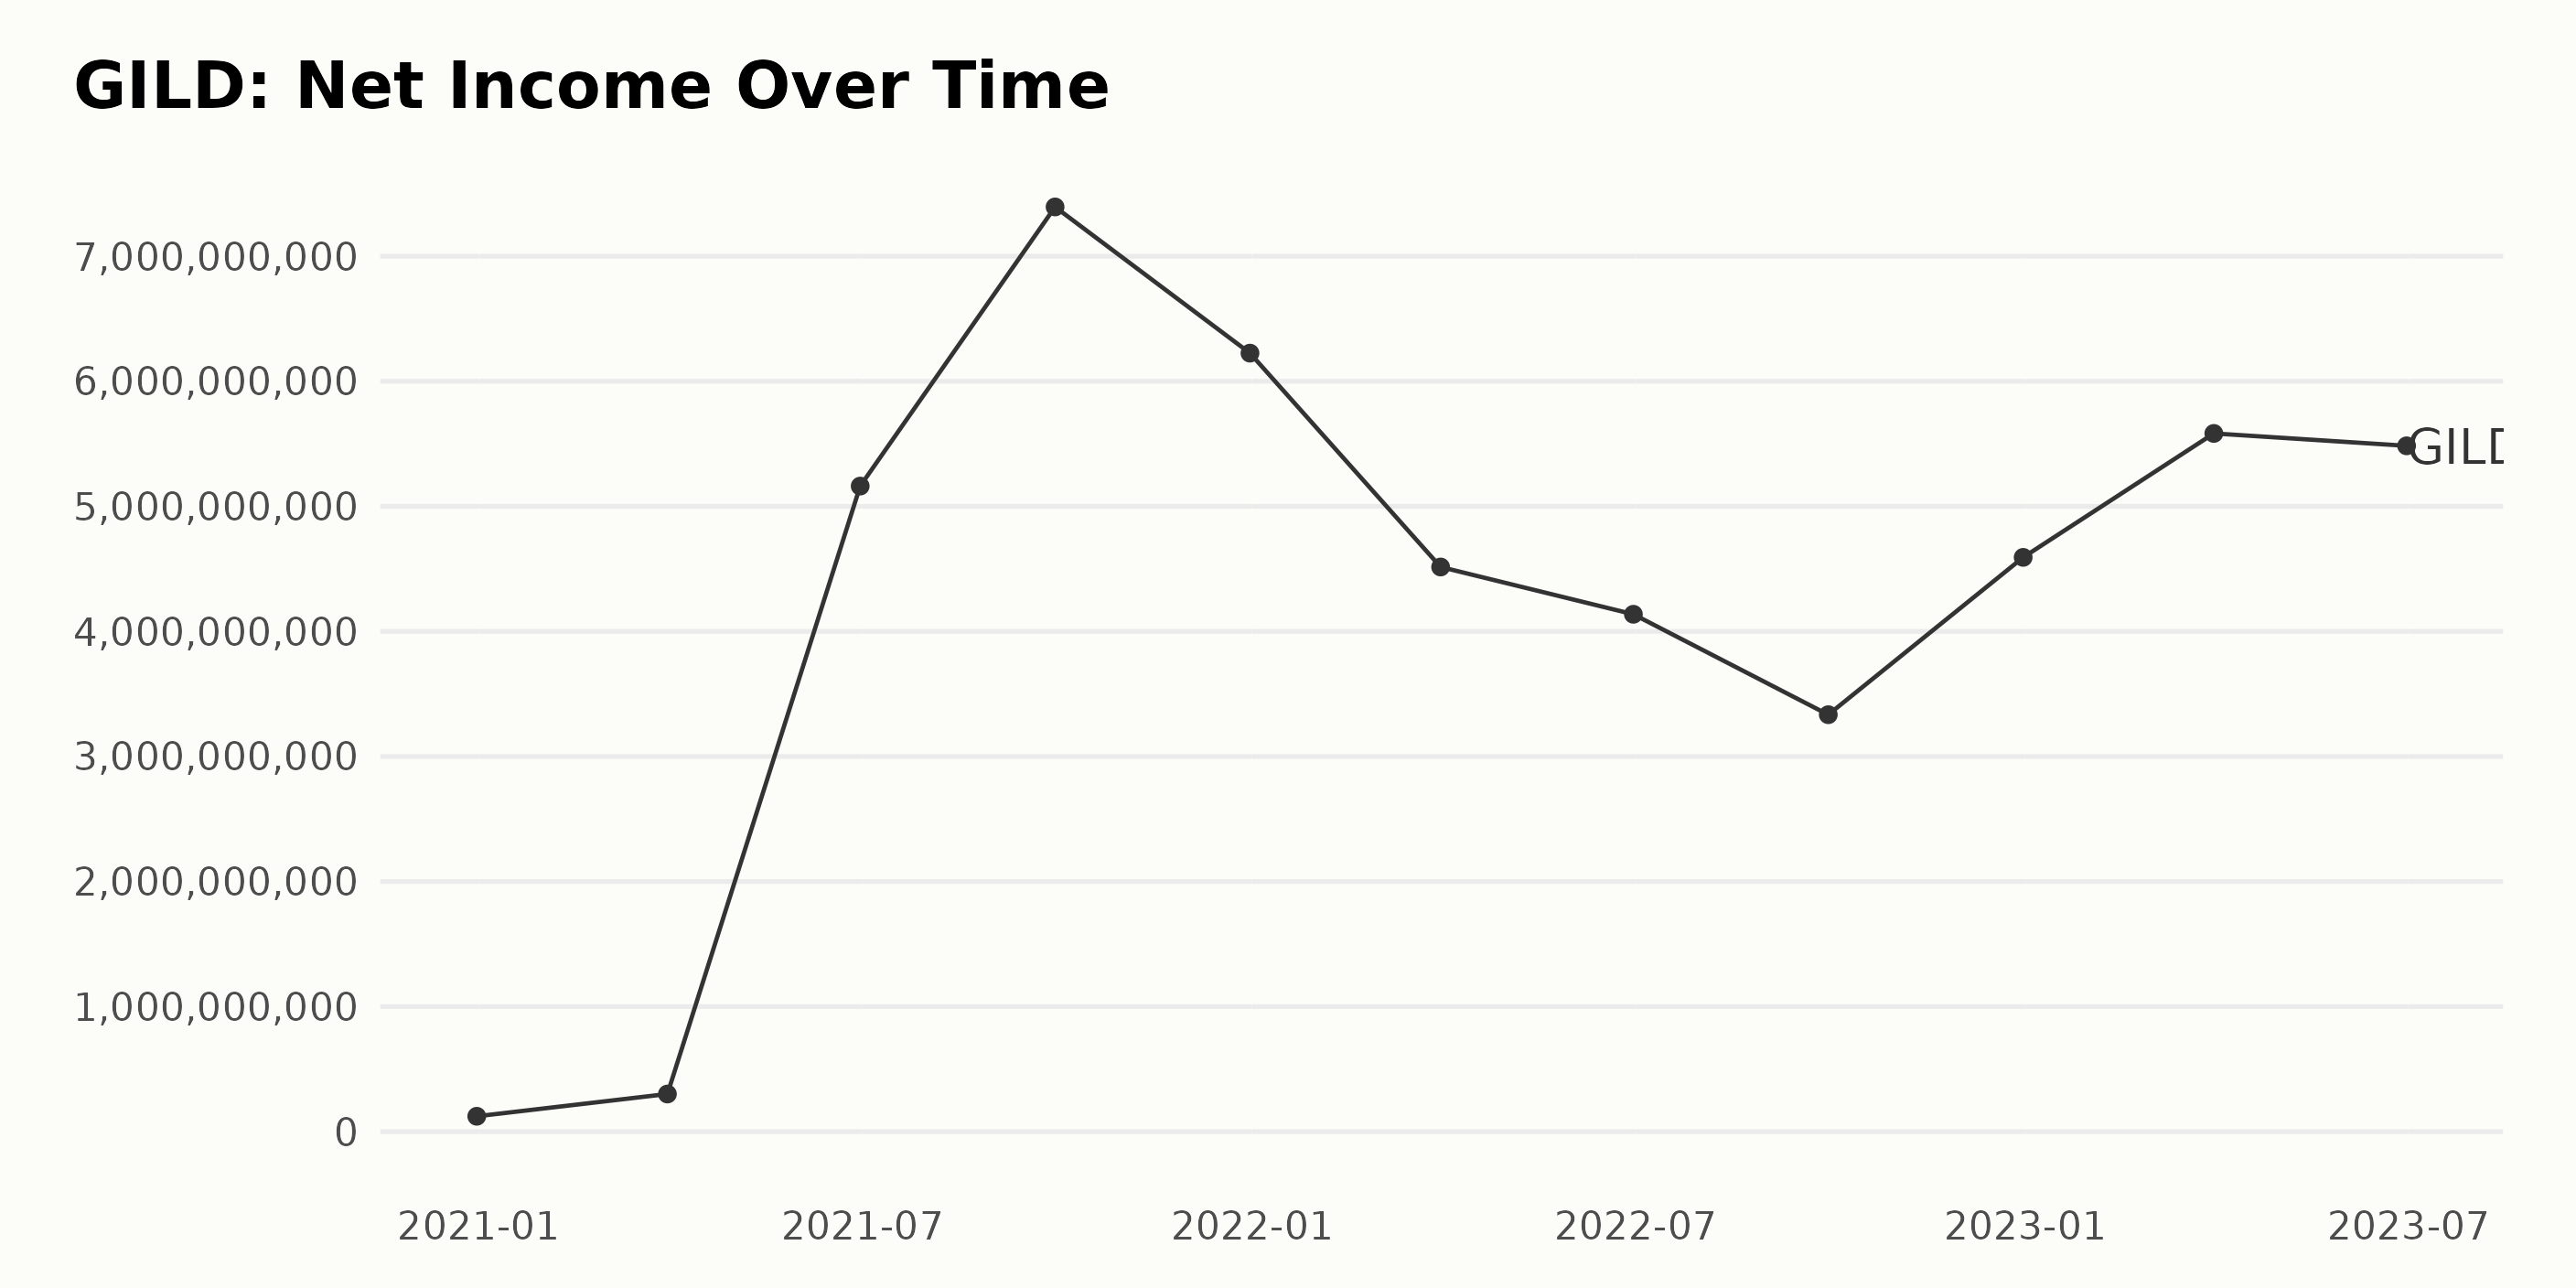
The trend and fluctuations of the trailing-12-month net income of Gilead Sciences Inc. (GILD) have seen notable changes over the period from 2020 to 2023. Reflecting on the series of data, major trends are as follows:
- As of December 2020, GILD reported a Net Income of $123 million.
- A growth was observed, with the Net Income climbing to $301 million in March 2021.
- The largest leap came in the second quarter of 2021, with a raise to $5.16 billion, maintaining a relatively high Net Income throughout the rest of 2021, peaking at $7.39 billion in September 2021.
- The year 2022, though started with a reduced Net Income of $4.52 billion by the end of March, had shown steady figures around the $4 billion to $3.33 billion range for most of the year.
- The Net Income saw an increase to $5.58 billion by March 2023 and maintained almost similar levels, standing at $5.48 billion at the end of June 2023. Comparing the first value in the series with the last, GILD’s net income has grown significantly. This represents a substantial increase, thereby indicating a solid performance for the company over the examined time frame.
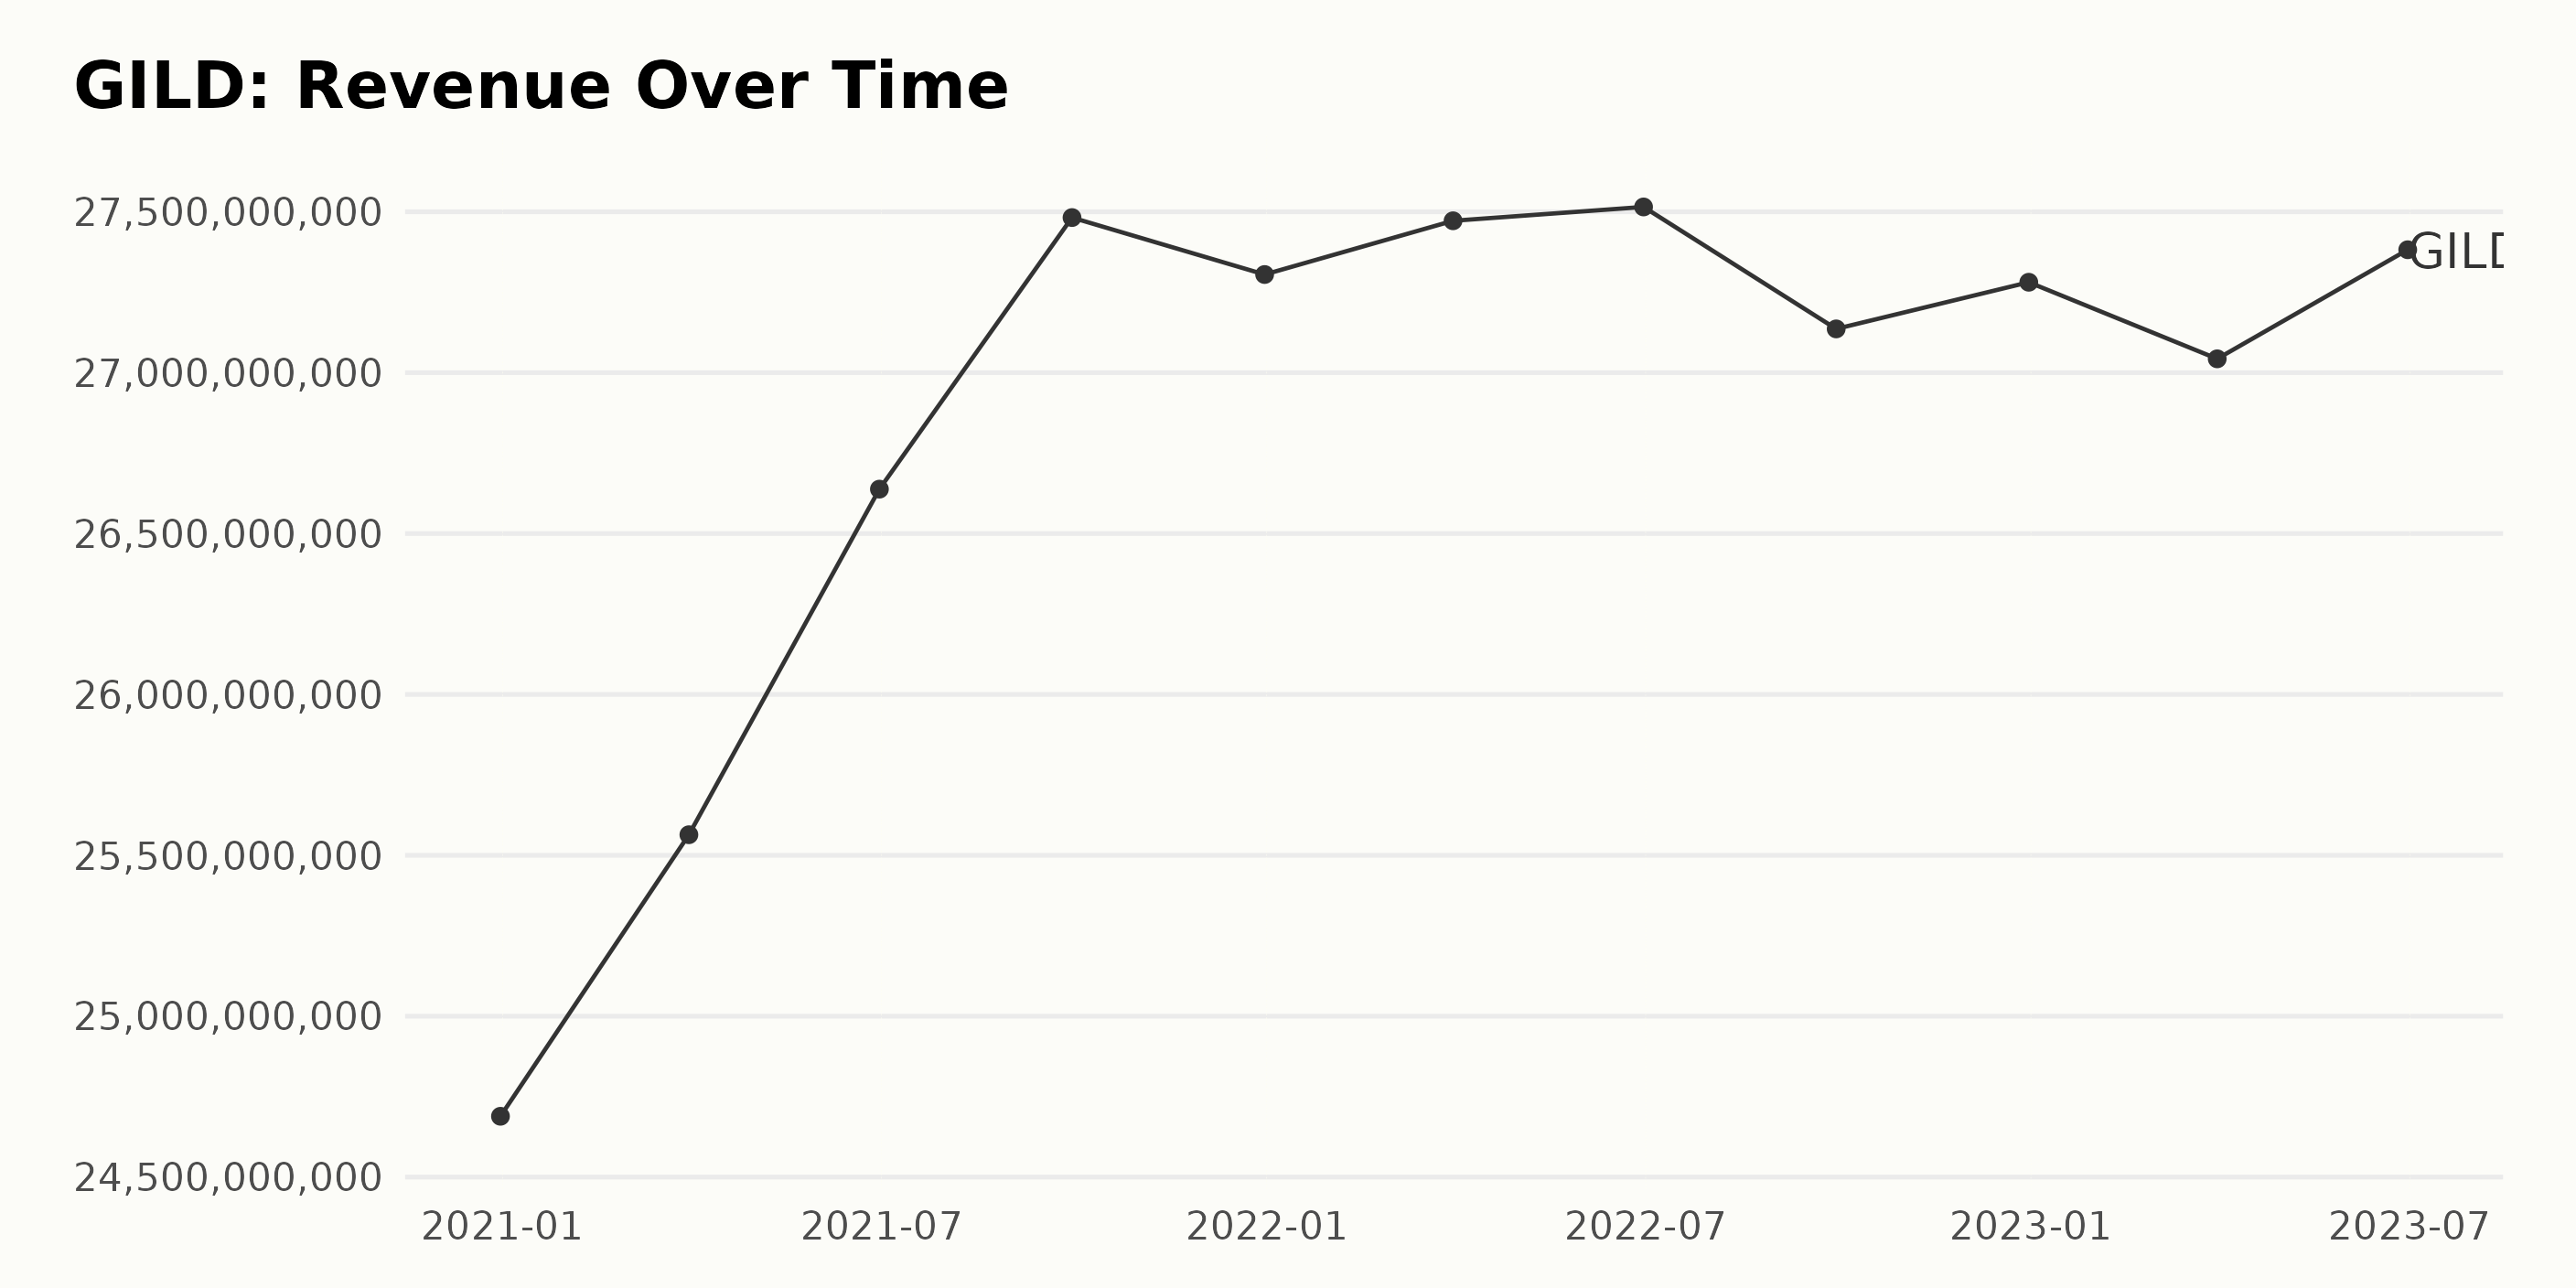
The trailing-12-month revenue data for Gilead Sciences Inc. (GILD) demonstrates an overall increasing trend during the period from December 31, 2020, through June 30, 2023, with some fluctuations. Here are the specific trends and fluctuations observed:
- Starting at $24.69 billion on December 31, 2020, Gilead Sciences’ Revenue showed a consistent increase through June 30, 2021, reaching $26.64 billion.
- Revenue peaked at $27.52 billion by the end of March 2022 but then noticed a slight decline in the following quarter(June 2022), with Revenue decreasing to $27.51 billion.
- Later, it followed an unexpected drop to its lowest at $27.04 billion by the end of September 2022 before slightly rebounding to $27.28 billion at the end of December 2022.
- There was another dip at $27.04 billion in the first quarter of 2023 (end of March 2023), but a subsequent rise was noticed to $27.38 billion by the end of June 2023, which represents the last value in the series.
The growth rate calculated from the first value ($24.69 billion on December 31, 2020) to the last recorded value ($27.38 billion on June 30, 2023), represents an increase of approximately 11% over the assessed period.
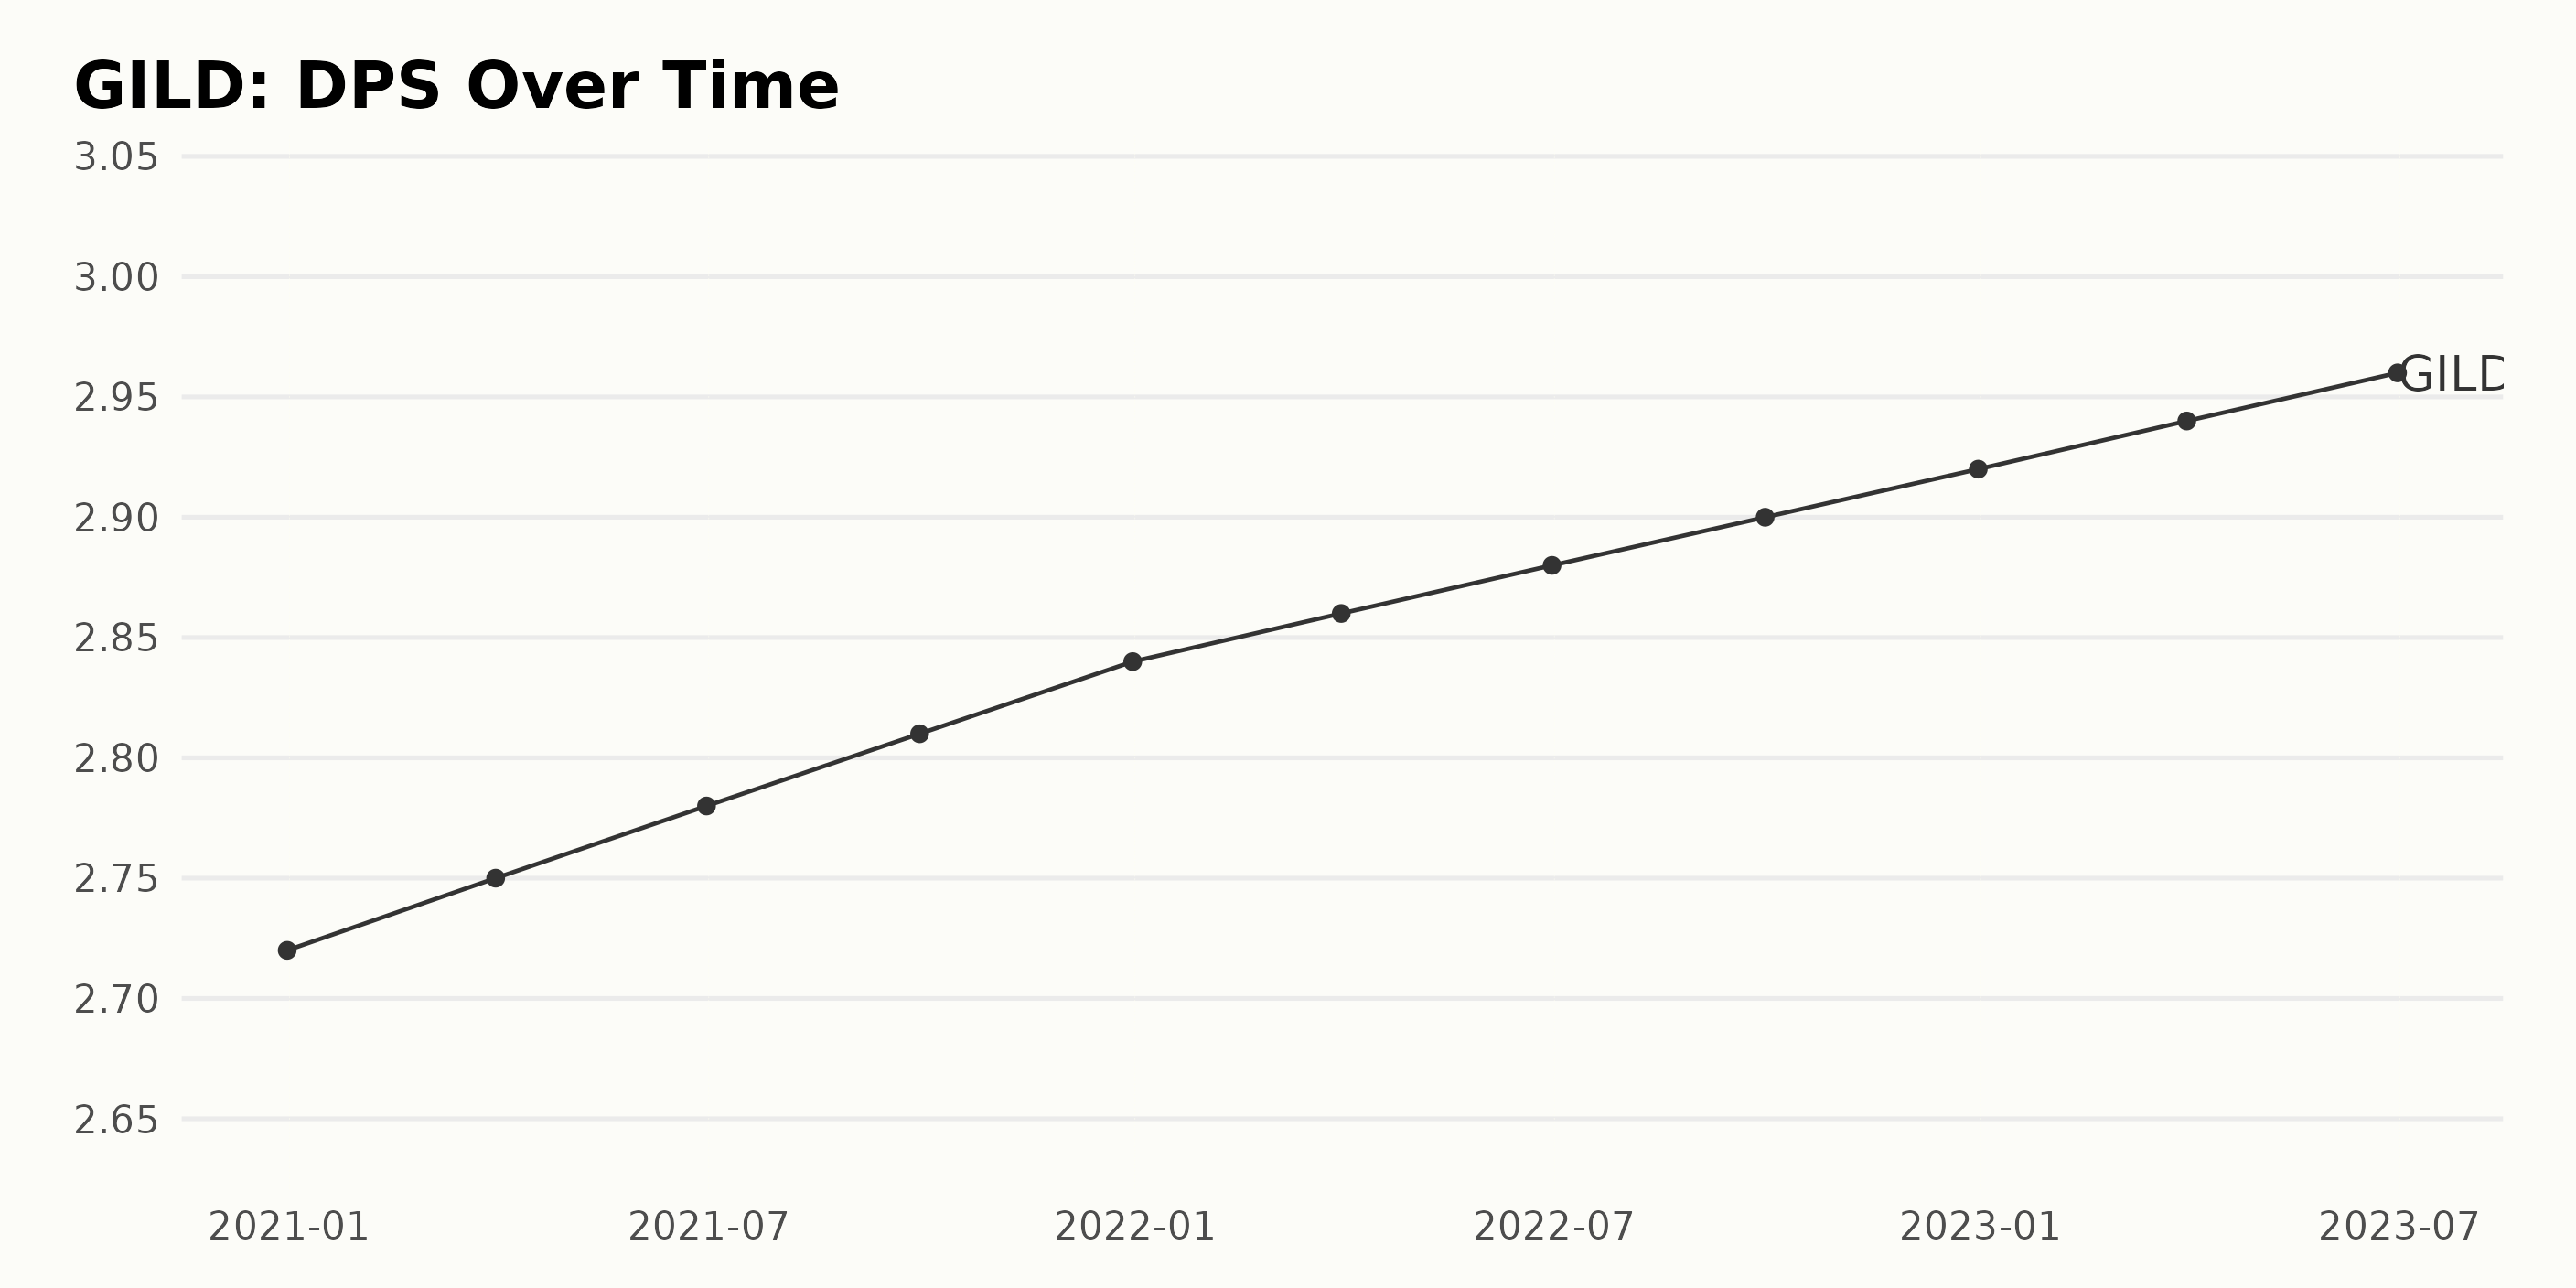
The DPS (Dividend Per Share) of GILD displayed a consistent upward trend from December 2020 through June 2023. Importantly, the series highlights a gradual increase in value rather than large spikes or drops, pointing towards steady growth. The growth rate of the DPS calculated over this period, measuring the last value from the first value, stood at approximately 8.8%, indicating a consistent improvement in shareholder returns.
An analysis of the quarterly data is as follows:
- In December 2020, the DPS started off at $2.72.
- By the end of March 2021, it saw a minor increase to $2.75.
- As of June 2021, it inched up further to $2.78.
- By September 2021, the DPS grew to $2.81.
- The end of December 2021 witnessed an increment to $2.84.
- March 2022 recorded a slight hike to $2.86.
- In June 2022, the value elevated to $2.88.
- By September 2022, it made another mild leap to $2.9.
- December 2022 saw the DPS rise to $2.92.
- In March 2023, the value was reported at $2.94.
- Finally, by June 2023, the DPS reached its highest at $2.96.
Overall, the data suggests a positive growth outlook for GILD’s DPS with an emphasis on the more recent and highest data point of $2.96 as of June 2023.
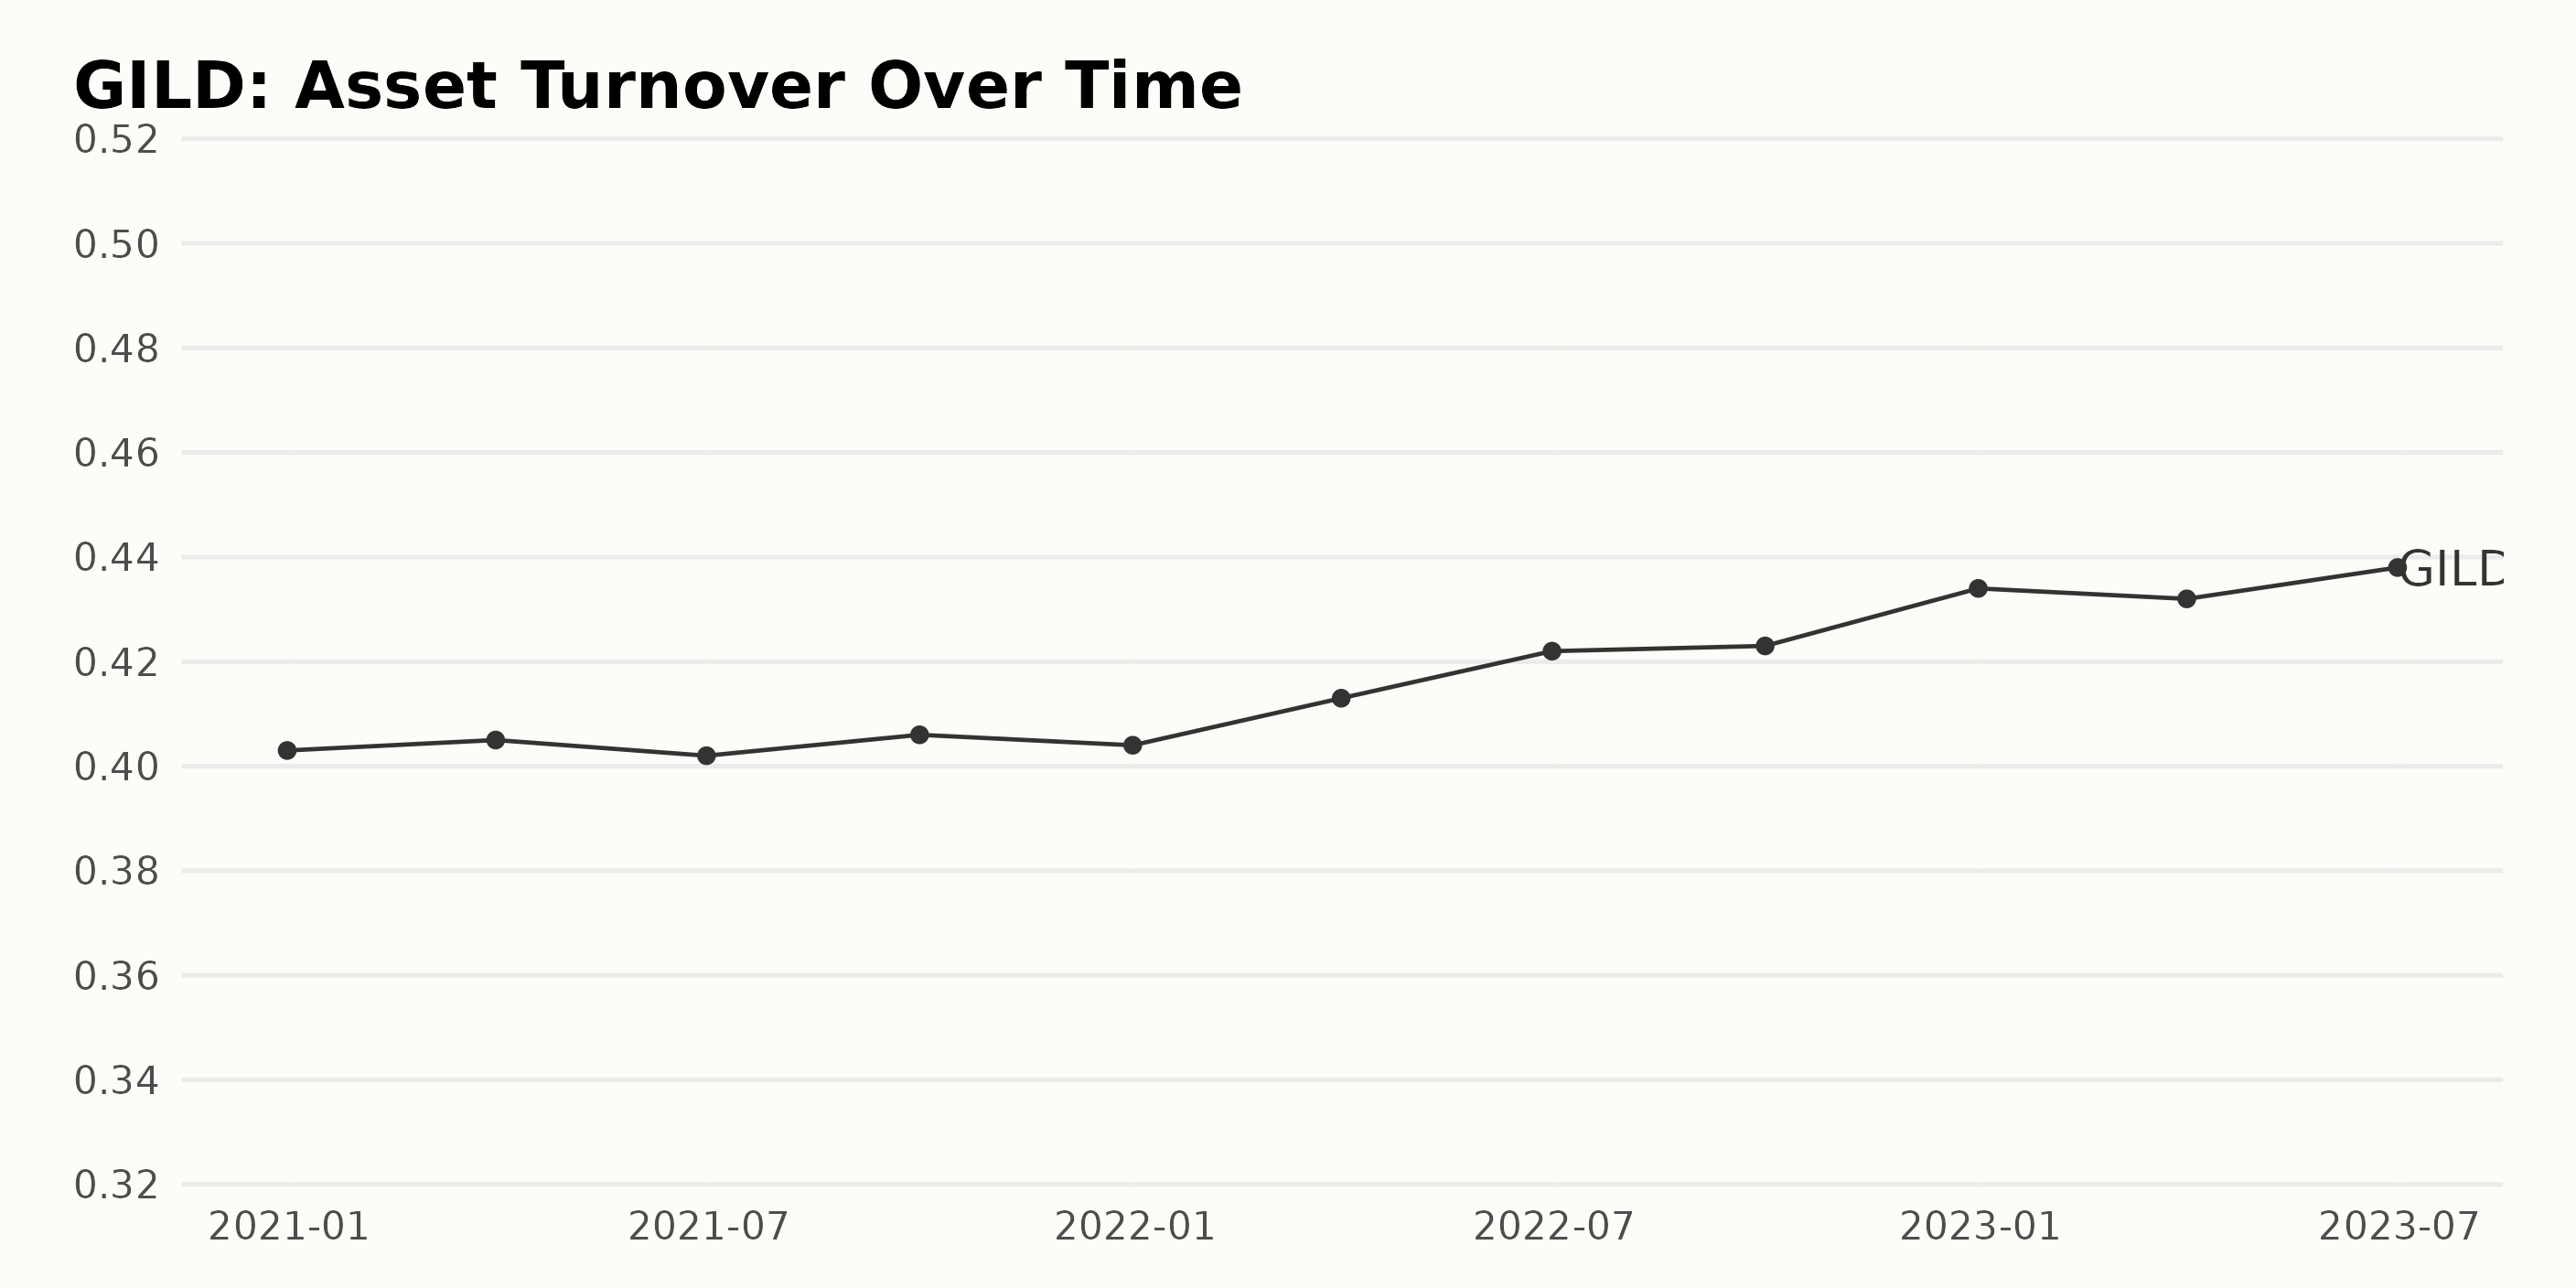
The Asset Turnover of GILD has shown an overall gradual increase from December 2020 to June 2023, with minor fluctuations in between. Here are the key details, broken down:
- Starting at 0.403 in December 2020, the Asset Turnover rose slightly to 0.405 by March 2021.
- There was a minor dip to 0.402 reported in June 2021.
- The figure then increased again, reaching 0.406 in September 2021 and continuing upwards to 0.404 by the end of 2021.
- In the first quarter of 2022, the Asset Turnover was 0.413, which marked a slight increase from the value reported at the end of the previous year.
- This upward trend sustained, reaching 0.422 by June 2022 and further increasing to 0.423 by September 2022.
- The Asset Turnover witnessed another rise by the end of 2022, hitting 0.434.
- Declining slightly to 0.432 in March 2023, it then recovered and increased to 0.438 by June 2023.
In terms of growth rate, calculated by comparing the last value from the first one, there has been a growth of approximately 8.7%, demonstrating an overall positive trend despite the slight vagaries throughout this period.
Analyzing the Fluctuating Share Price Trend of Gilead Sciences Inc., May-November 2023
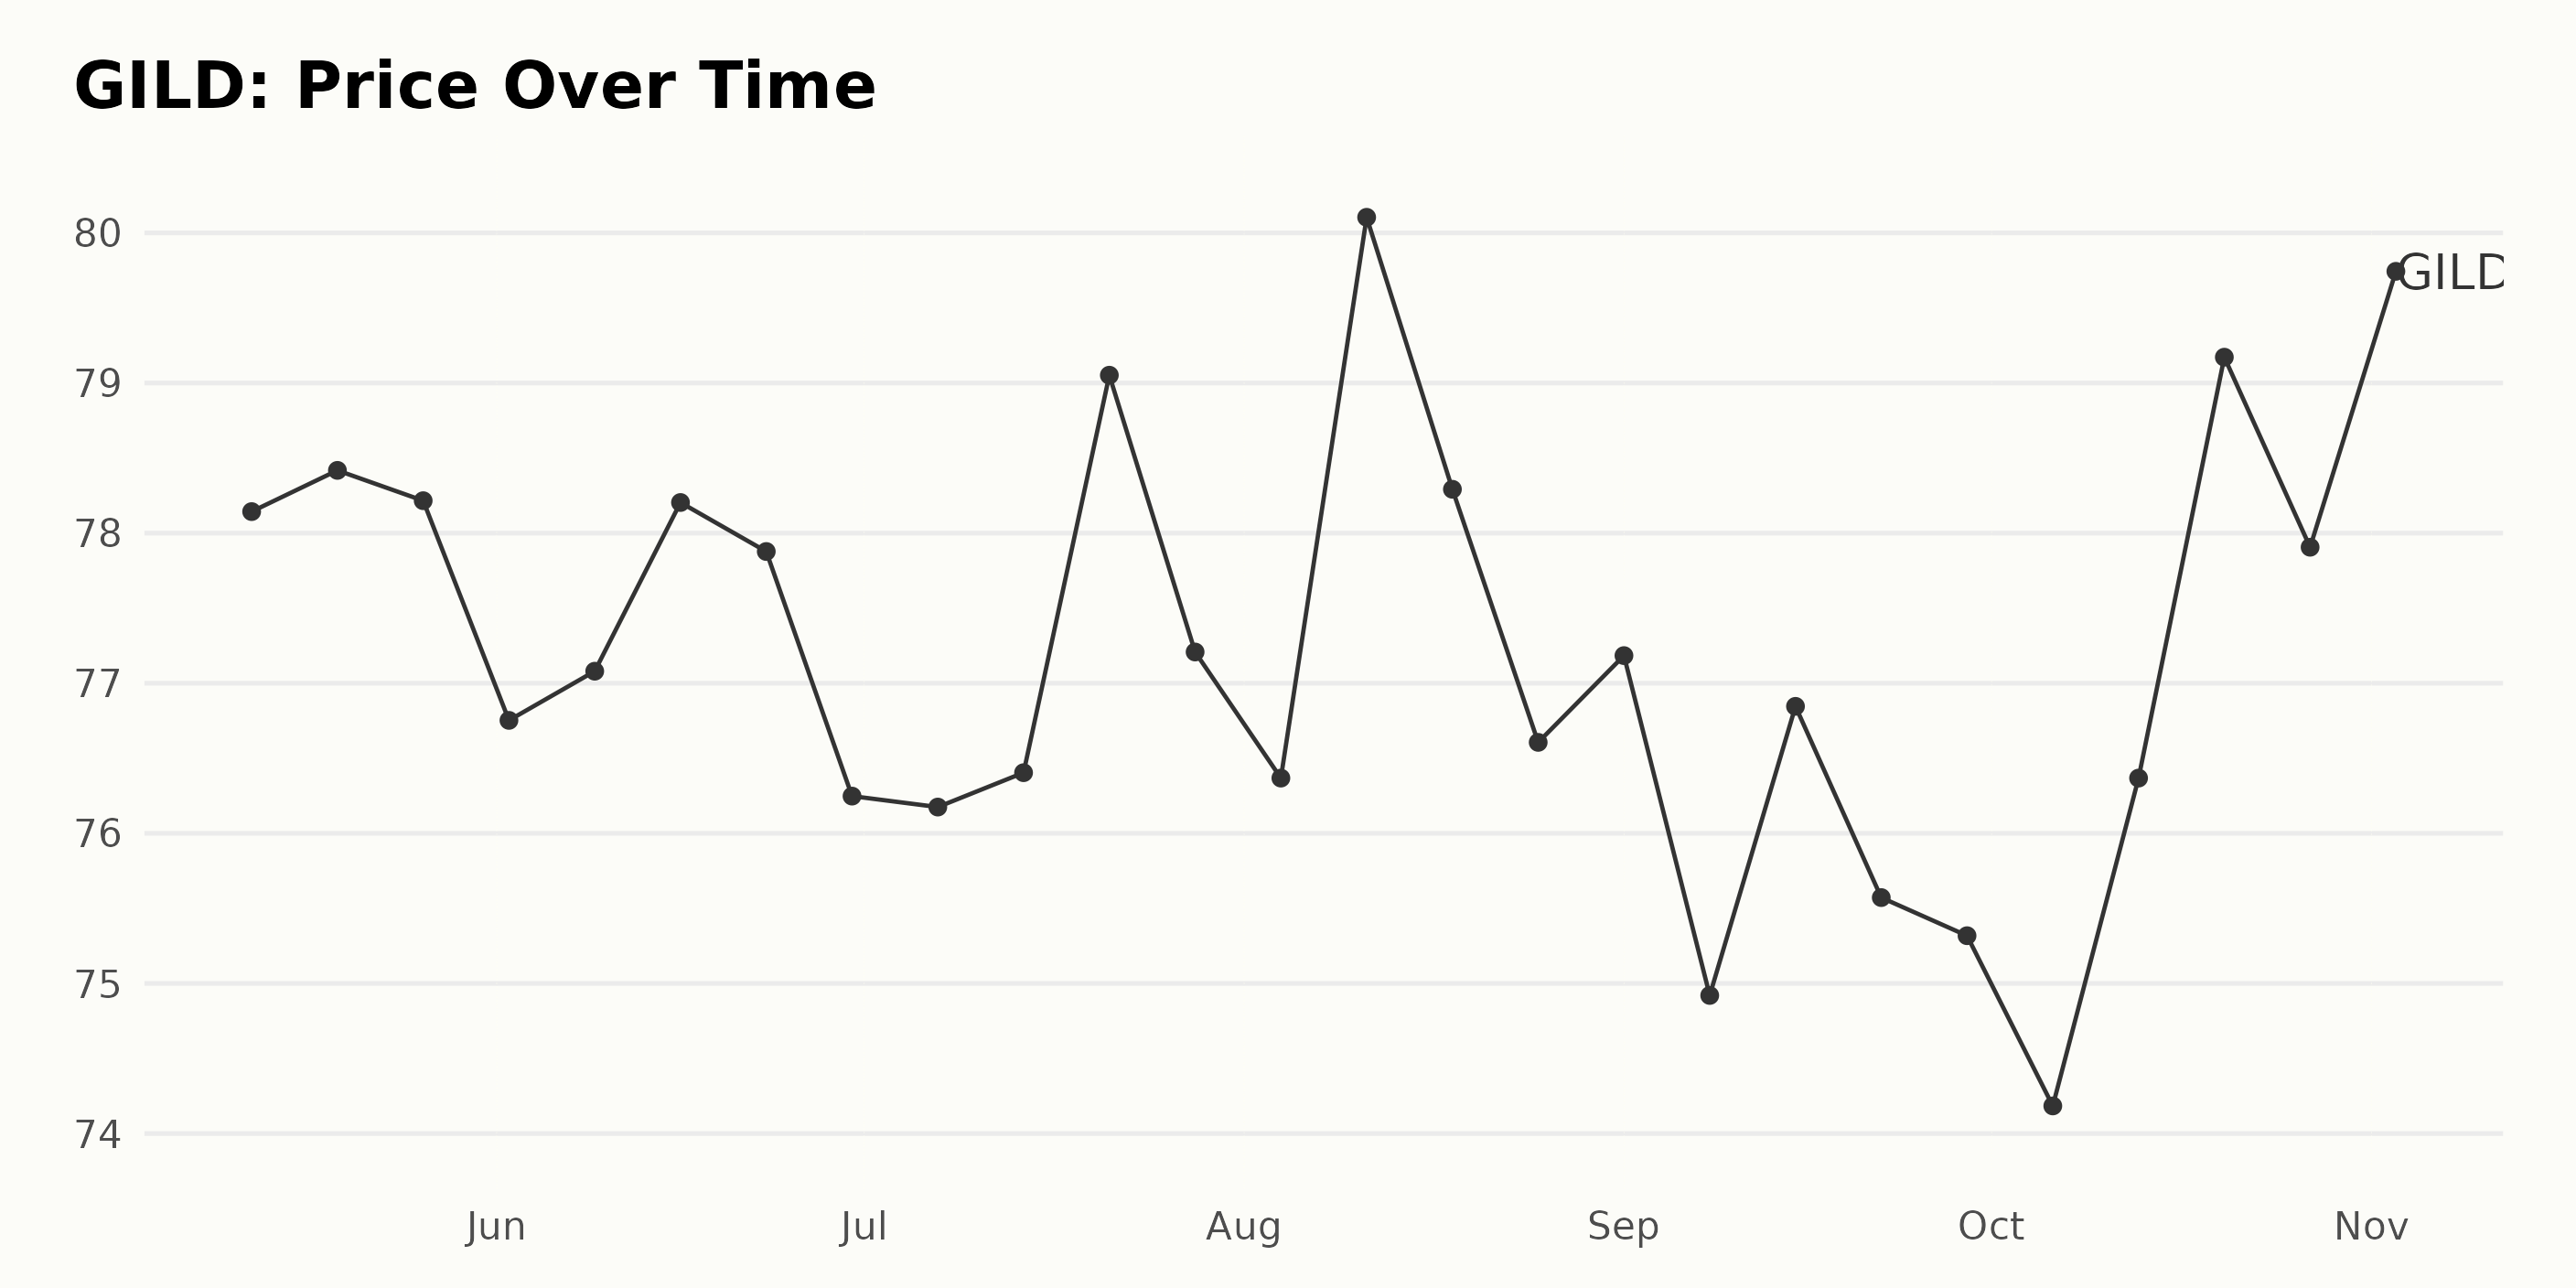
The data indicates a fluctuating trend in the share price of Gilead Sciences Inc. (GILD) from May 2023 to November 2023.
- Starting in May 2023, the price moderately increases from $78.14 on May 12 to $78.42 on May 19, then slightly trickles down to $78.22 by May 26.
- In June 2023, the shares saw an initial dip, reaching $76.75 by June 2. They rose slightly to $77.08 on June 9, peaked at $78.20 by June 16, and then began to drop again, closing the month at $76.25.
- During the course of July 2023, the shares remained relatively stable, starting at $76.18 on July 7 and increasing to $79.05 on July 21 before closing the month at $77.21.
- The share price experienced a moderate upward surge in August 2023, rising to the highest point of $80.10 on August 11, followed by a decline to close the month at $76.61.
- In September 2023, a noticeable overall downward trend is seen, with prices dipping to a low of $74.92 by September 8 and rebounding moderately to close the month at $75.32.
- October shows a recovery with a start of $74.18 on October 6 and a boost to $79.17 by October 20, followed by a slight decrease to $77.91 by the end of the month.
- There’s an ascending trend in November, wherein the share closes on a high note at $79.74 on November 3.
In terms of growth rate, the share price has shown periodic ups and downs over these months. The maximum growth noted in a single week is around $3.65 (from $76.37 on August 4 to $80.10 on August 11). The largest decline within a week is nearly -$2.41 (from $78.29 on August 18 to $75.88 on August 25). However, from May to November 2023, the overall growth rate remains positive, with the share price increasing from $78.14 to $79.74 despite the intermittent fluctuations. Here is a chart of GILD’s price over the past 180 days.
Exploring Gilead Sciences Inc.’s Quality, Value, and Stability: A POWR Ratings Review
GILD has an overall A rating, translating to a Strong Buy in our POWR Ratings system. It is ranked #2 out of the 350 stocks in the Biotech category.
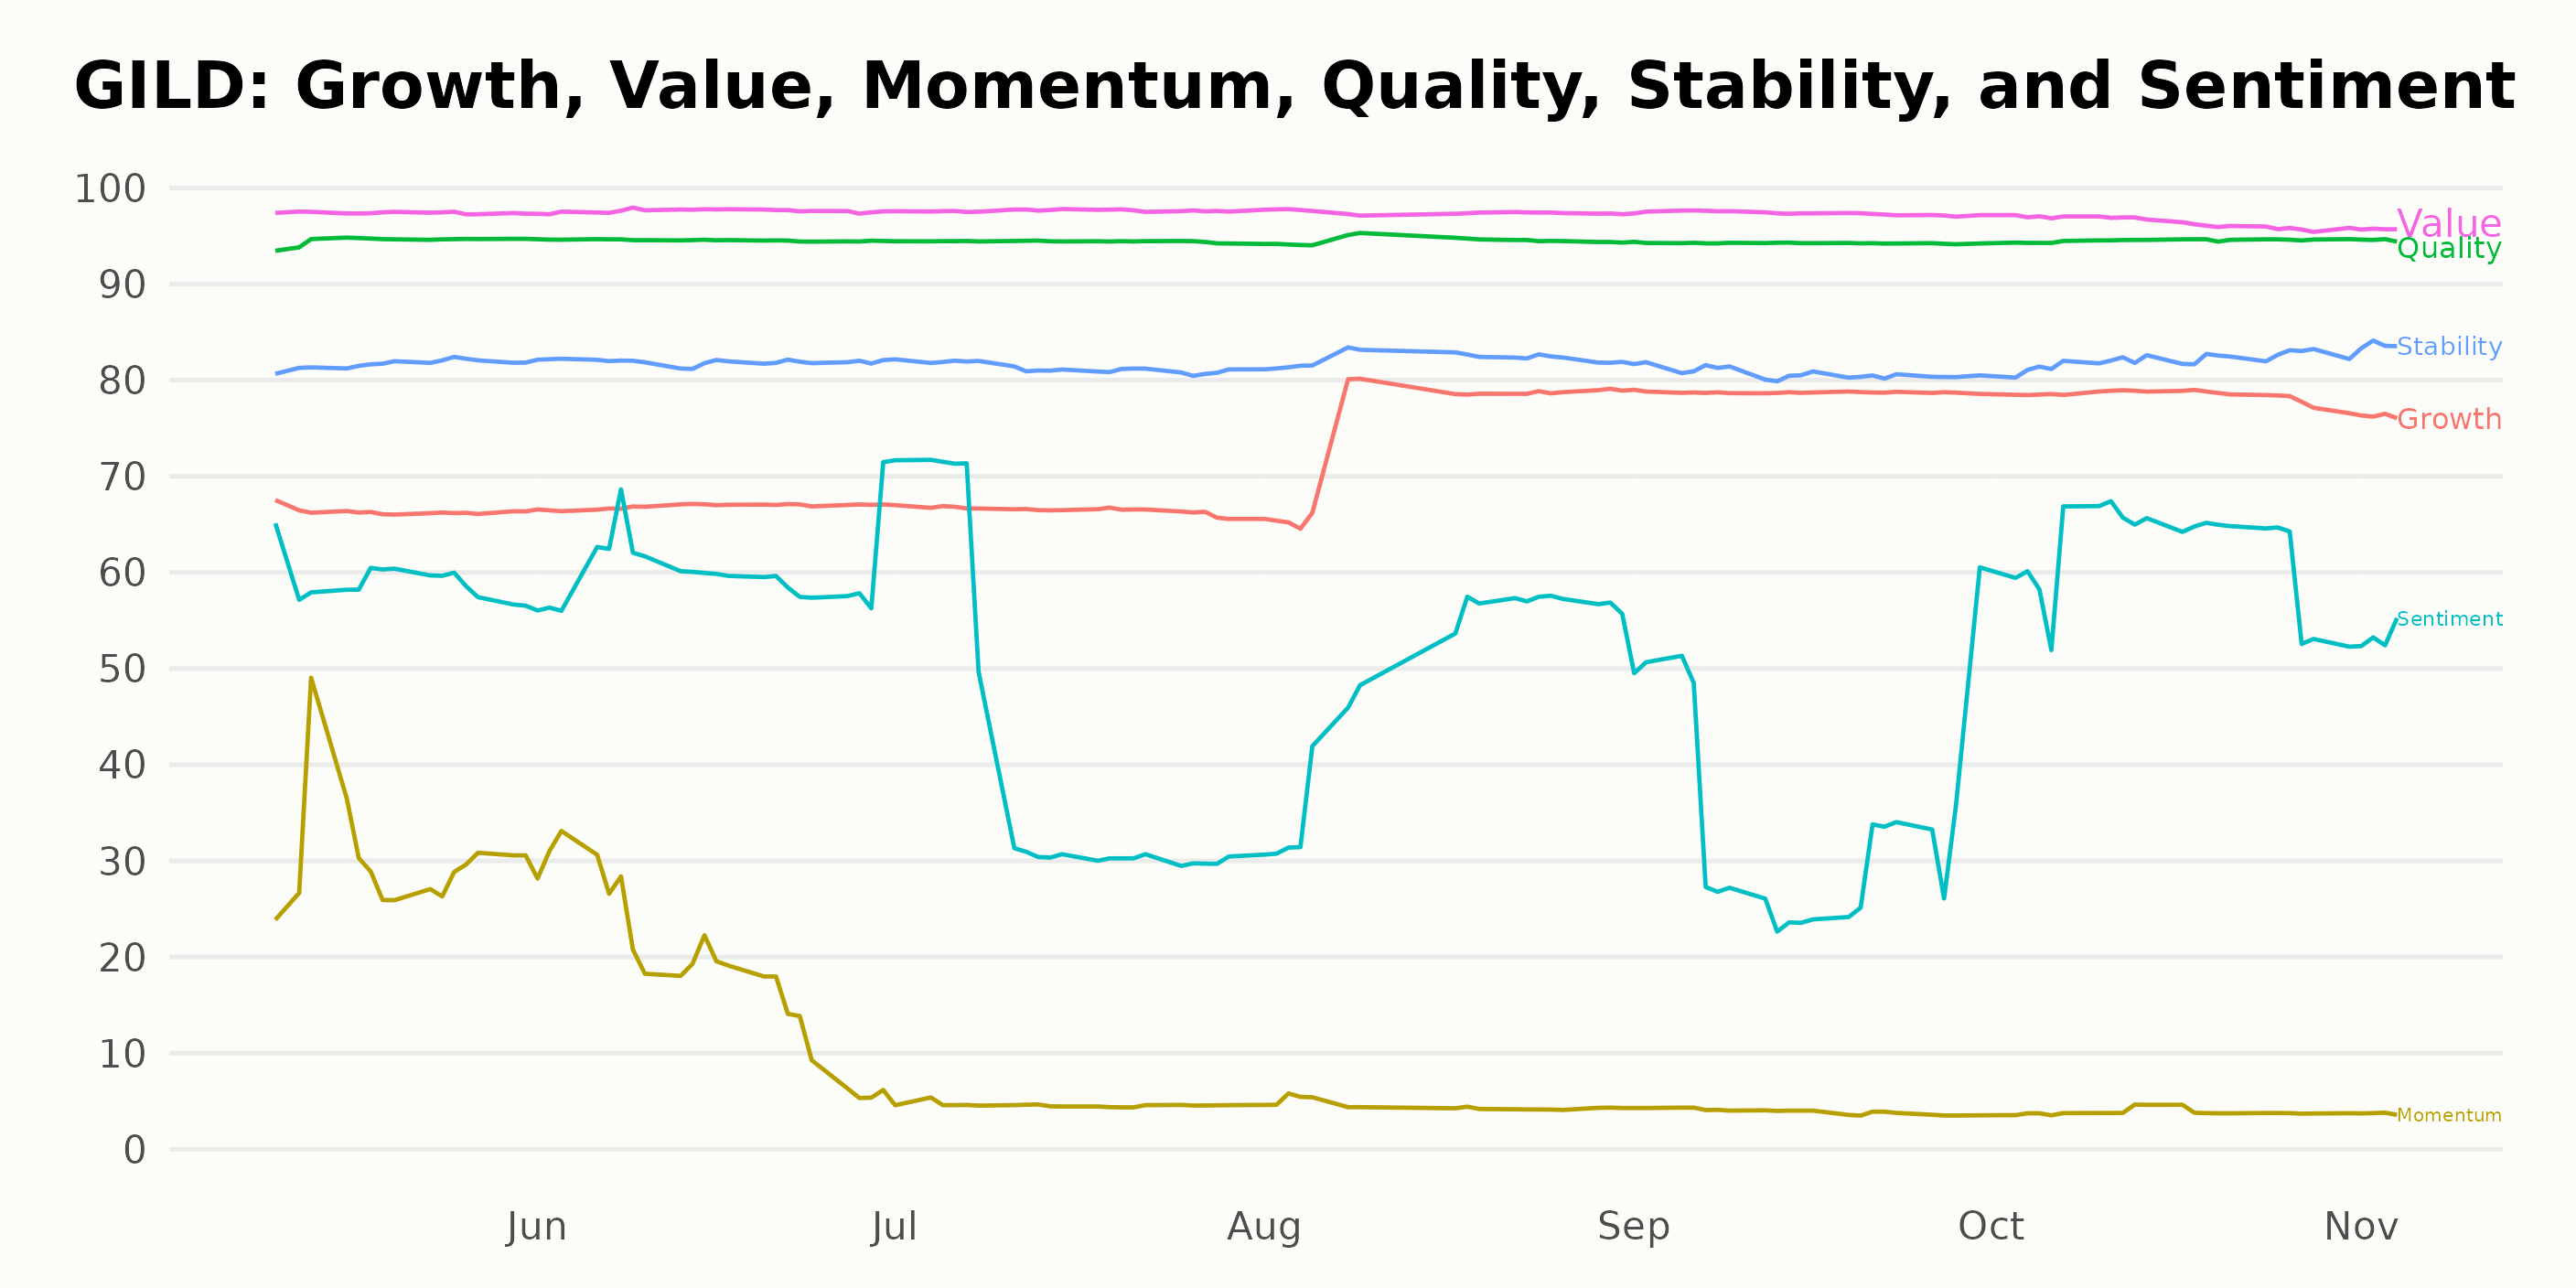
Upon review of the POWR Ratings for Gilead Sciences Inc. (GILD), we observe three noteworthy dimensions: Quality, Value, and Stability. Here is a deeper look at these core parameters:
Quality
- In May 2023, the Quality dimension had a powerful rating, valuing at 95.
- This high rating maintained a steady value over the months till July 2023 with no fluctuations.
- Even after a slight dip in August 2023 to 94, it managed to bounce back to 95 by October 2023 and remained the same until November 2023.
Value
- The Value dimension began strong in May 2023 with an impressive score of 97.
- June 2023 saw a spike at 98, maintaining high ratings throughout the observed period.
- A slight decline to 96 was observed later in October 2023 and remained through November 2023. Nevertheless, the overall trend clearly demonstrated robust value ratings for GILD.
Stability
- The Stability dimension showed consistently high ratings from May to October 2023, maintaining a stable score of 82.
- By November 2023, the rating further improved slightly to 84, indicating a higher stability.
These trends underline that GILD demonstrated robust Quality, Value, and Stability in its operations according to the POWR Ratings across the recorded duration.
How does Gilead Sciences Inc. (GILD) Stack Up Against its Peers?
Other stocks in the Biotech sector that may be worth considering are Otsuka Holdings Co Ltd (OTSKY), Alexion Pharmaceuticals Inc. (ALXN), and Corcept Therapeutics Incorporated (CORT) -- they have better POWR Ratings.
What To Do Next?
Get your hands on this special report with 3 low priced companies with tremendous upside potential even in today’s volatile markets:
3 Stocks to DOUBLE This Year >
GILD shares were trading at $80.99 per share on Monday afternoon, down $0.60 (-0.74%). Year-to-date, GILD has declined -2.90%, versus a 14.84% rise in the benchmark S&P 500 index during the same period.
About the Author: Subhasree Kar

Subhasree’s keen interest in financial instruments led her to pursue a career as an investment analyst. After earning a Master’s degree in Economics, she gained knowledge of equity research and portfolio management at Finlatics.
The post Gilead Sciences (GILD) Earnings Forecast and Gameplan appeared first on StockNews.com