
Building products company Quanex (NYSE: NX) beat Wall Street’s revenue expectations in Q1 CY2026, with sales up 2.2% year on year to $462.4 million. Its non-GAAP profit of $0.25 per share was 23.5% above analysts’ consensus estimates.
Is now the time to buy Quanex? Find out by accessing our full research report, it’s free.
Quanex (NX) Q1 CY2026 Highlights:
- Revenue: $462.4 million vs analyst estimates of $459.6 million (2.2% year-on-year growth, 0.6% beat)
- Adjusted EPS: $0.25 vs analyst estimates of $0.20 (23.5% beat)
- Adjusted EBITDA: $44.17 million vs analyst estimates of $42.55 million (9.6% margin, 3.8% beat)
- Operating Margin: 4%, down from 9% in the same quarter last year
- Free Cash Flow Margin: 1.7%, down from 3% in the same quarter last year
- Market Capitalization: $824.6 million
George Wilson, Chairman, President and Chief Executive Officer, commented, “Despite the headwinds our industry is facing, demand for the products we manufacture was as expected during the second quarter of 2026. Rapid inflationary pressures related to macroeconomic concerns and the ongoing conflict in the Middle East led to an unfavorable price versus cost dynamic, which pressured our margins. As previously disclosed, we utilize surcharges to respond to rapid increases in costs and we have index pricing mechanisms in place in North America to handle fluctuations in major raw material costs, but when costs increase quickly there is a timing lag and margins are negatively impacted. We are addressing the current price versus cost imbalance to minimize further negative impact and expect to recover some of the shortfall to date during the second half of this year, assuming volumes continue to track the normal seasonality of our business, and the rate of inflationary pressure subsides.
Company Overview
Starting in the seamless tube industry, Quanex (NYSE: NX) manufactures building products like window, door, kitchen, and bath cabinet components.
Revenue Growth
A company’s long-term sales performance is one signal of its overall quality. Any business can put up a good quarter or two, but many enduring ones grow for years. Over the last five years, Quanex grew its sales at an exceptional 13.9% compounded annual growth rate. Its growth beat the average industrials company and shows its offerings resonate with customers.
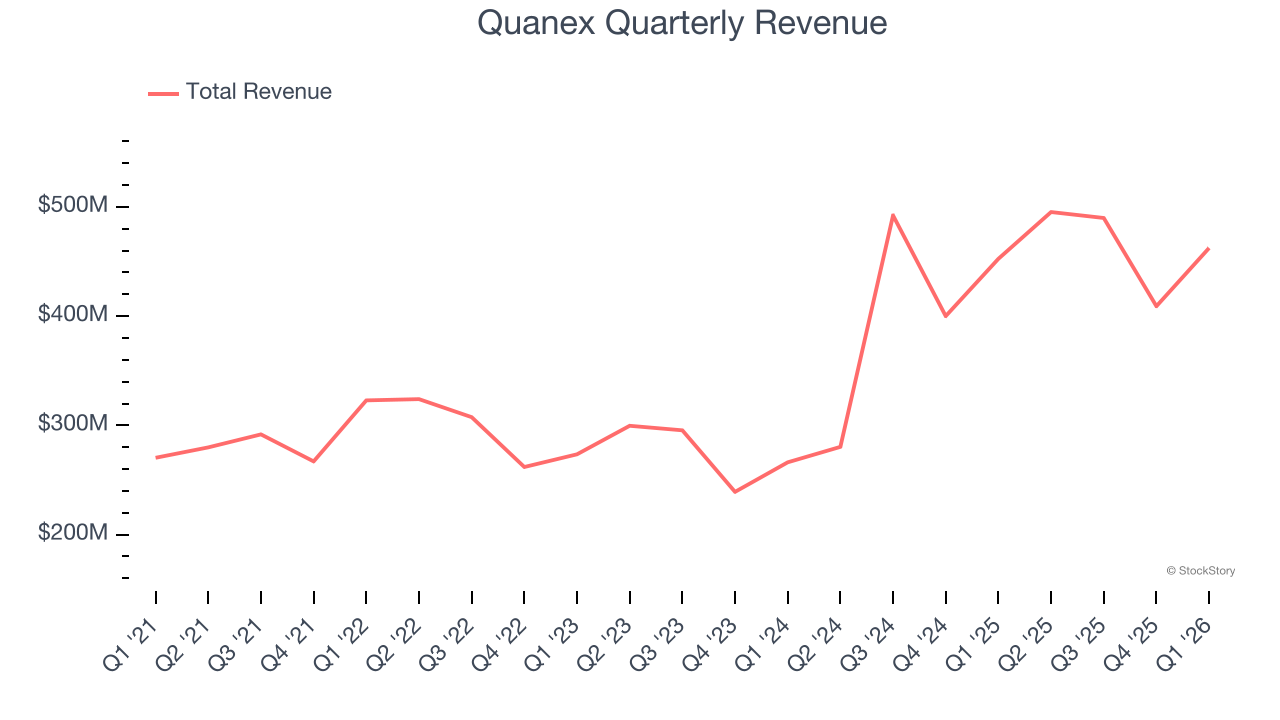
We at StockStory place the most emphasis on long-term growth, but within industrials, a half-decade historical view may miss cycles, industry trends, or a company capitalizing on catalysts such as a new contract win or a successful product line. Quanex’s annualized revenue growth of 29.9% over the last two years is above its five-year trend, suggesting its demand was strong and recently accelerated. 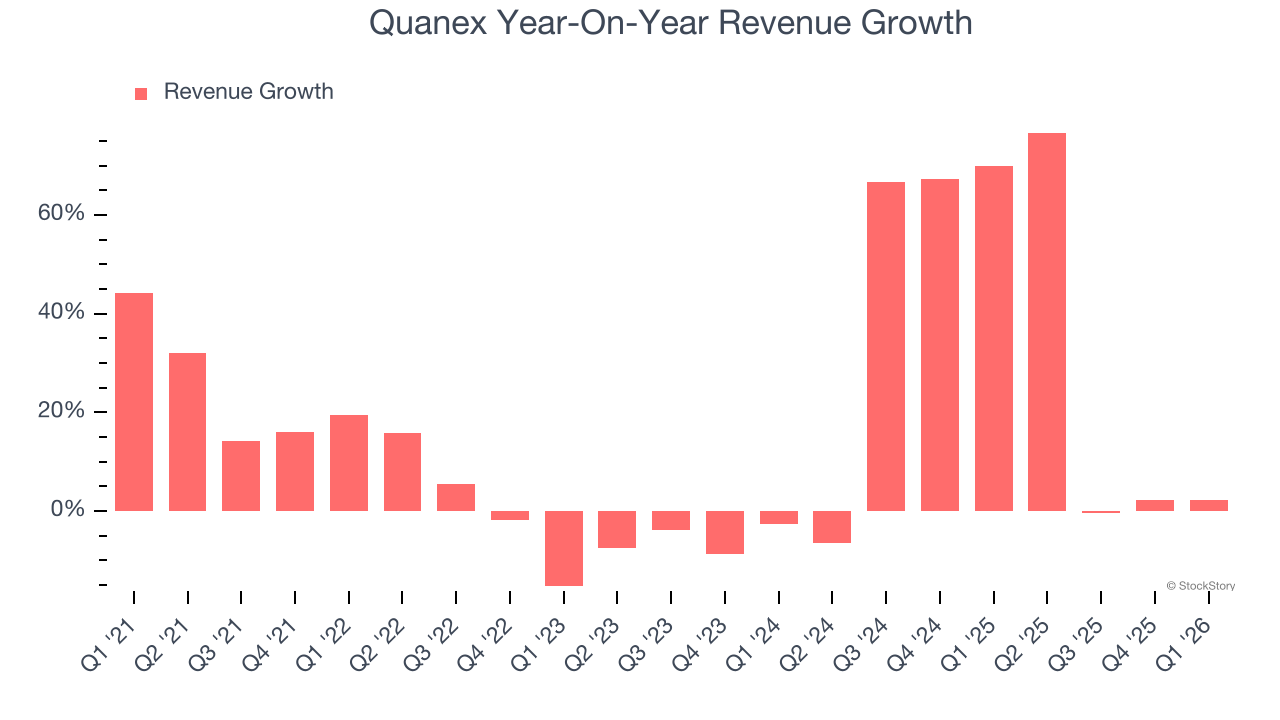
We can better understand the company’s revenue dynamics by analyzing its most important segments, Fenestration and Cabinet Components, which are 32.7% and 11.1% of revenue. Over the last two years, Quanex’s Fenestration revenue (window and door components, North America only) averaged 6.3% year-on-year declines while its Cabinet Components revenue (cabinet parts, North America only) was flat. 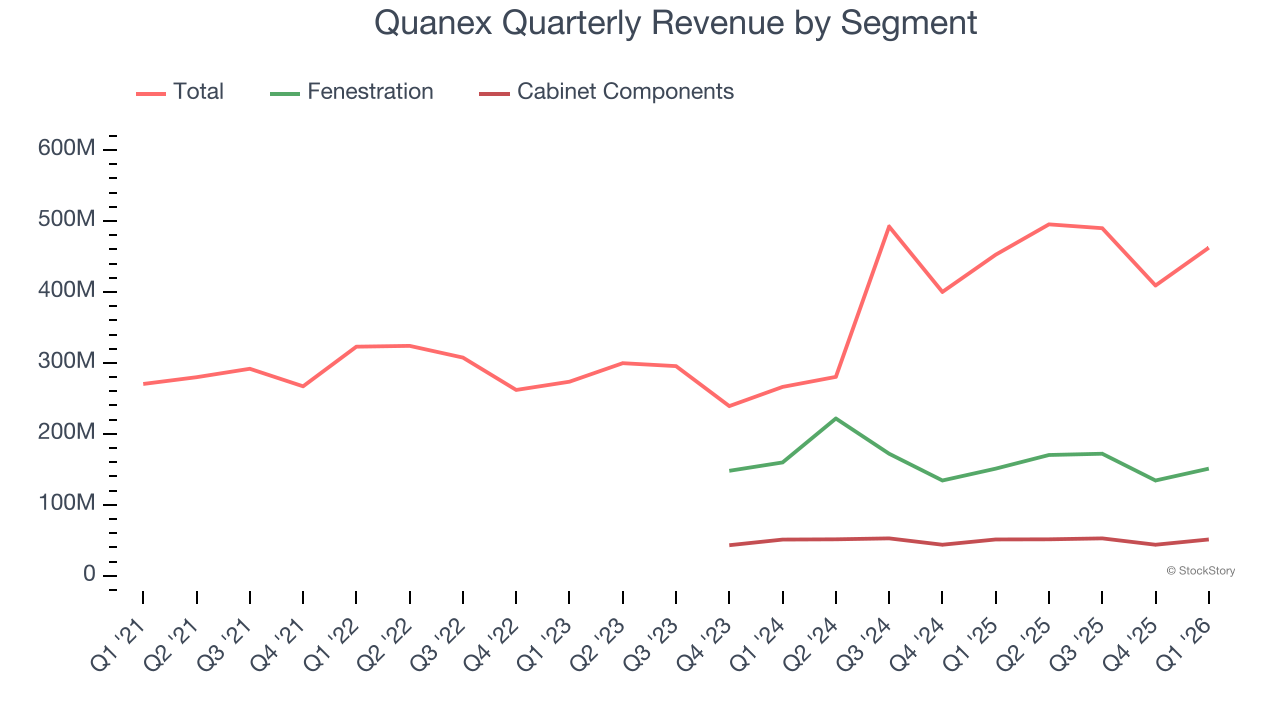
This quarter, Quanex reported modest year-on-year revenue growth of 2.2% but beat Wall Street’s estimates by 0.6%.
Looking ahead, sell-side analysts expect revenue to remain flat over the next 12 months, a deceleration versus the last two years. This projection is underwhelming and indicates its products and services will face some demand challenges.
ONE MORE THING: The $21 AI Application Stock Wall Street Forgot. While Wall Street obsesses over who’s building AI, one company is already using it to print money. And nobody’s paying attention.
AI chip stocks trade at ridiculous valuations. This company processes a trillion consumer signals monthly using AI and trades at a third of the price. The gap won’t last. The institutions will figure it out. You need to see this first. Read the FREE Report Before They Notice.
Operating Margin
Operating margin is an important measure of profitability as it shows the portion of revenue left after accounting for all core expenses — everything from the cost of goods sold to advertising and wages. It’s also useful for comparing profitability across companies with different levels of debt and tax rates because it excludes interest and taxes.
Quanex was profitable over the last five years but held back by its large cost base. Its average operating margin of 2.2% was weak for an industrials business. This result isn’t too surprising given its low gross margin as a starting point.
Looking at the trend in its profitability, Quanex’s operating margin decreased by 19.5 percentage points over the last five years. This raises questions about the company’s expense base because its revenue growth should have given it leverage on its fixed costs, resulting in better economies of scale and profitability. Quanex’s performance was poor no matter how you look at it - it shows that costs were rising and it couldn’t pass them onto its customers.
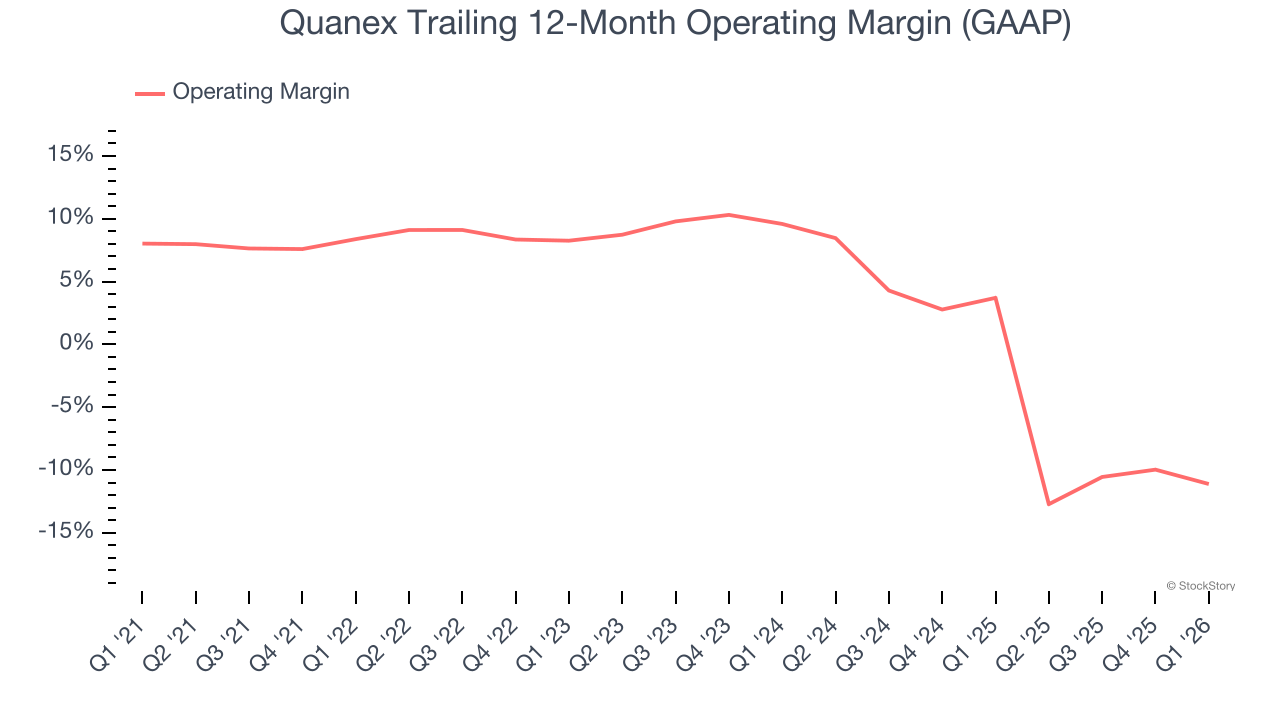
In Q1, Quanex generated an operating margin profit margin of 4%, down 5 percentage points year on year. Since Quanex’s operating margin decreased more than its gross margin, we can assume it was less efficient because expenses such as marketing, R&D, and administrative overhead increased.
Earnings Per Share
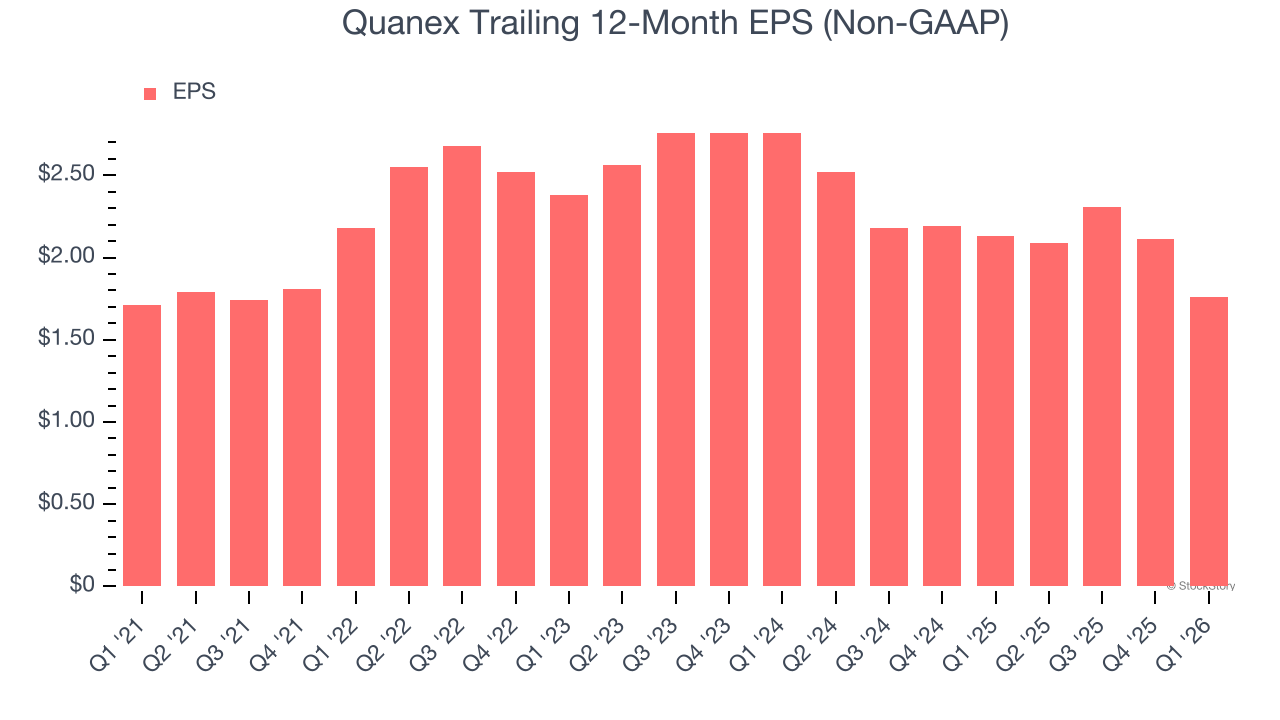
We track the long-term change in earnings per share (EPS) for the same reason as long-term revenue growth. Compared to revenue, however, EPS highlights whether a company’s growth is profitable.
Quanex’s flat EPS over the last five years was below its 13.9% annualized revenue growth. This tells us the company became less profitable on a per-share basis as it expanded.
We can take a deeper look into Quanex’s earnings to better understand the drivers of its performance. As we mentioned earlier, Quanex’s operating margin declined by 19.5 percentage points over the last five years. Its share count also grew by 35.7%, meaning the company not only became less efficient with its operating expenses but also diluted its shareholders. 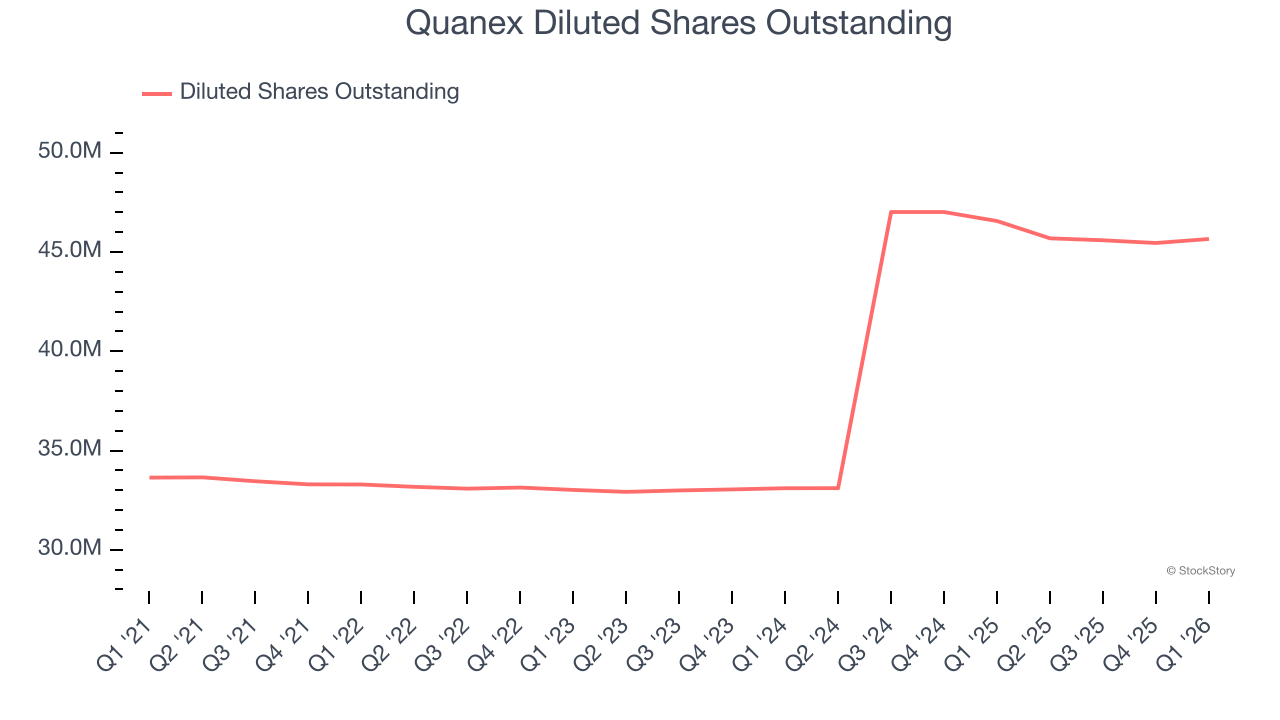
Like with revenue, we analyze EPS over a more recent period because it can provide insight into an emerging theme or development for the business.
For Quanex, its two-year annual EPS declines of 20.1% show its recent history was to blame for its underperformance over the last five years. These results were bad no matter how you slice the data.
In Q1, Quanex reported adjusted EPS of $0.25, down from $0.60 in the same quarter last year. Despite falling year on year, this print easily cleared analysts’ estimates. Over the next 12 months, Wall Street expects Quanex’s full-year EPS to grow 1.1% from $1.76 to $1.78.
Key Takeaways from Quanex’s Q1 Results
It was good to see Quanex beat analysts’ EPS expectations this quarter. We were also glad its adjusted operating income outperformed Wall Street’s estimates. Zooming out, we think this quarter featured some important positives. The market seemed to be hoping for more, and the stock traded down 7.3% to $16.52 immediately after reporting.
Is Quanex an attractive investment opportunity right now? What happened in the latest quarter matters, but not as much as longer-term business quality and valuation, when deciding whether to invest in this stock. We cover that in our actionable full research report which you can read here (it’s free).