

Medical technology company Teleflex (NYSE: TFX) reported Q1 CY2026 results beating Wall Street’s revenue expectations, with sales up 32.3% year on year to $548.3 million. Its non-GAAP profit of $1.39 per share was 14% above analysts’ consensus estimates.
Is now the time to buy Teleflex? Find out by accessing our full research report, it’s free.
Teleflex (TFX) Q1 CY2026 Highlights:
- Revenue: $548.3 million vs analyst estimates of $533.4 million (32.3% year-on-year growth, 2.8% beat)
- Adjusted EPS: $1.39 vs analyst estimates of $1.22 (14% beat)
- Adjusted Operating Income: $26.93 million vs analyst estimates of $89.5 million (4.9% margin, 69.9% miss)
- Management reiterated its full-year Adjusted EPS guidance of $6.40 at the midpoint
- Operating Margin: 3.7%, down from 30.3% in the same quarter last year
- Free Cash Flow Margin: 5.1%, down from 10.5% in the same quarter last year
- Constant Currency Revenue rose 5.1% year on year (-3.8% in the same quarter last year)
- Market Capitalization: $5.45 billion
"Our first-quarter performance reflects disciplined execution and meaningful progress against our transformation plan," said Stuart Randle, Teleflex's Interim President and Chief Executive Officer.
Company Overview
With a portfolio spanning from vascular access catheters to minimally invasive surgical tools, Teleflex (NYSE: TFX) designs, manufactures, and supplies single-use medical devices used in critical care and surgical procedures across hospitals worldwide.
Revenue Growth
A company’s long-term performance is an indicator of its overall quality. Any business can put up a good quarter or two, but many enduring ones grow for years. Teleflex’s demand was weak over the last five years as its sales fell at a 3.6% annual rate. This wasn’t a great result and suggests it’s a low quality business.
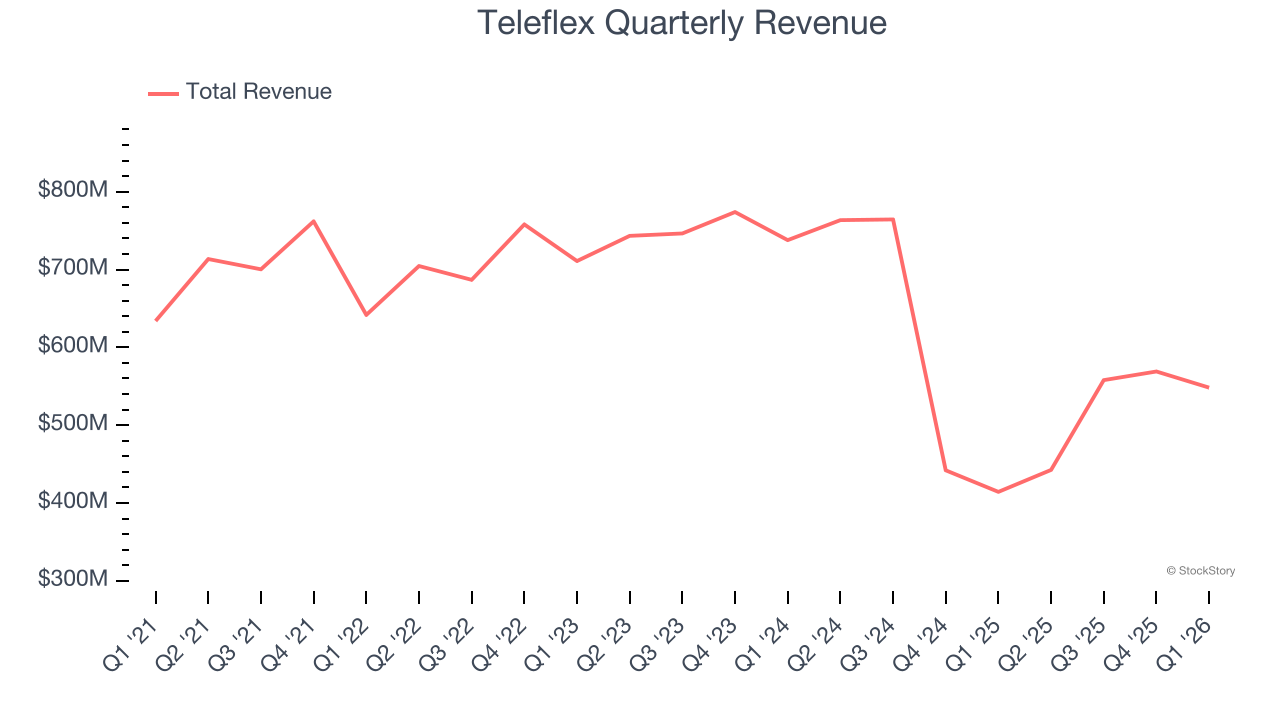
We at StockStory place the most emphasis on long-term growth, but within healthcare, a half-decade historical view may miss recent innovations or disruptive industry trends. Teleflex’s recent performance shows its demand remained suppressed as its revenue has declined by 16% annually over the last two years. 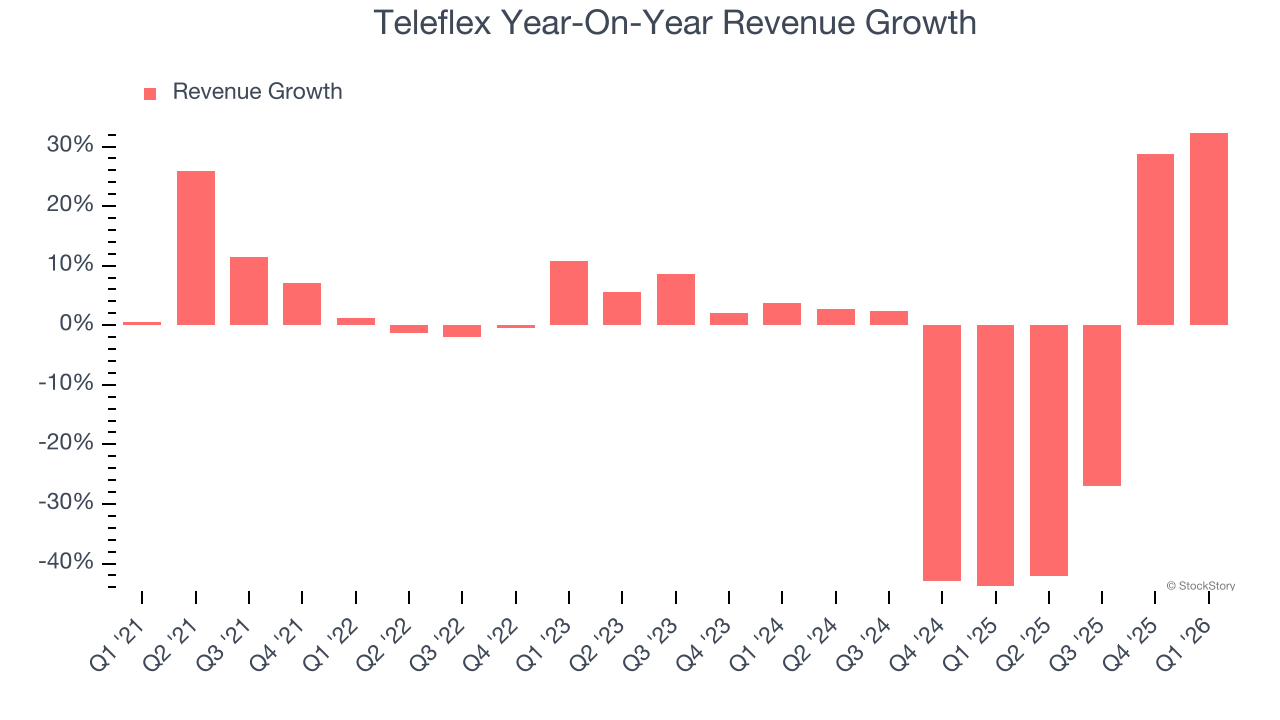
We can better understand the company’s sales dynamics by analyzing its constant currency revenue, which excludes currency movements that are outside their control and not indicative of demand. Over the last two years, its constant currency sales averaged 3.8% year-on-year growth. Because this number is better than its normal revenue growth, we can see that foreign exchange rates have been a headwind for Teleflex. 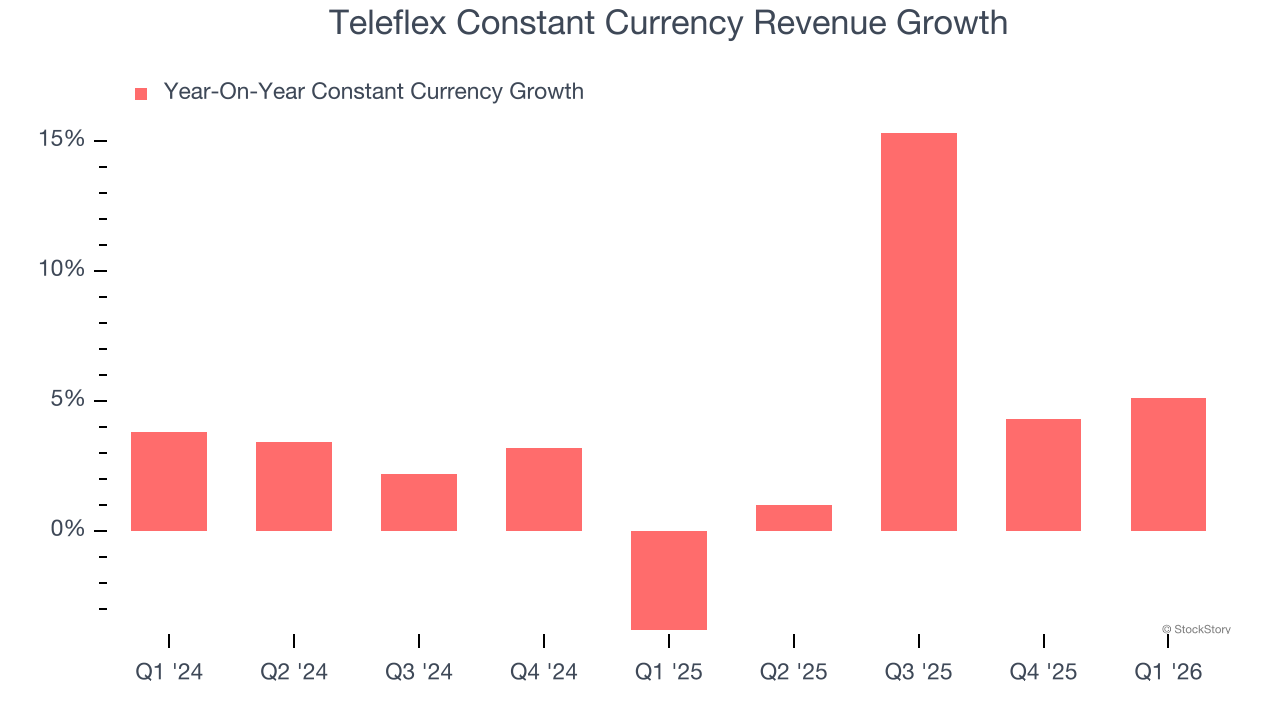
This quarter, Teleflex reported wonderful year-on-year revenue growth of 32.3%, and its $548.3 million of revenue exceeded Wall Street’s estimates by 2.8%.
Looking ahead, sell-side analysts expect revenue to grow 9.4% over the next 12 months, an improvement versus the last two years. This projection is commendable and implies its newer products and services will spur better top-line performance.
ALSO WORTH WATCHING: Nvidia’s Quiet Partner. Nvidia’s chips cost a hundred grand. The connectors that make them work cost even more. One company makes them all.
Every AI server needs specialized infrastructure the chip companies don’t make. High-speed cables. Power connectors. Thermal sensors. This 90-year-old company built a monopoly on it. The AI boom just started. This stock is still flying under the radar. Claim The Stock Ticker Here for FREE.
Adjusted Operating Margin
Teleflex has been an efficient company over the last five years. It was one of the more profitable businesses in the healthcare sector, boasting an average adjusted operating margin of 23.8%.
Analyzing the trend in its profitability, Teleflex’s adjusted operating margin decreased by 9.5 percentage points over the last five years. The company’s two-year trajectory also shows it failed to get its profitability back to the peak as its margin fell by 4.1 percentage points. This performance was poor no matter how you look at it - it shows its expenses were rising and it couldn’t pass those costs onto its customers.
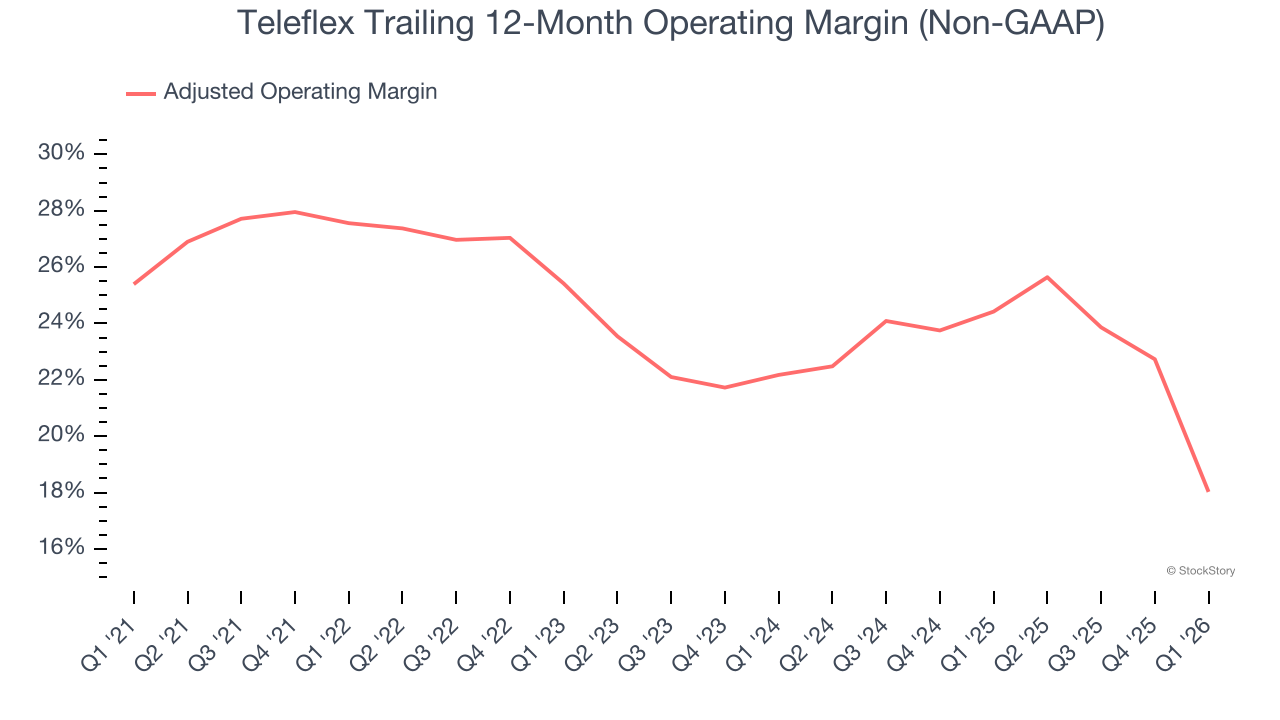
This quarter, Teleflex generated an adjusted operating margin profit margin of 4.9%, down 18.3 percentage points year on year. This contraction shows it was less efficient because its expenses grew faster than its revenue.
Earnings Per Share
Revenue trends explain a company’s historical growth, but the long-term change in earnings per share (EPS) points to the profitability of that growth – for example, a company could inflate its sales through excessive spending on advertising and promotions.
Teleflex’s flat EPS over the last five years was weak but better than its 3.6% annualized revenue declines. However, this alone doesn’t tell us much about its business quality because its adjusted operating margin didn’t improve.
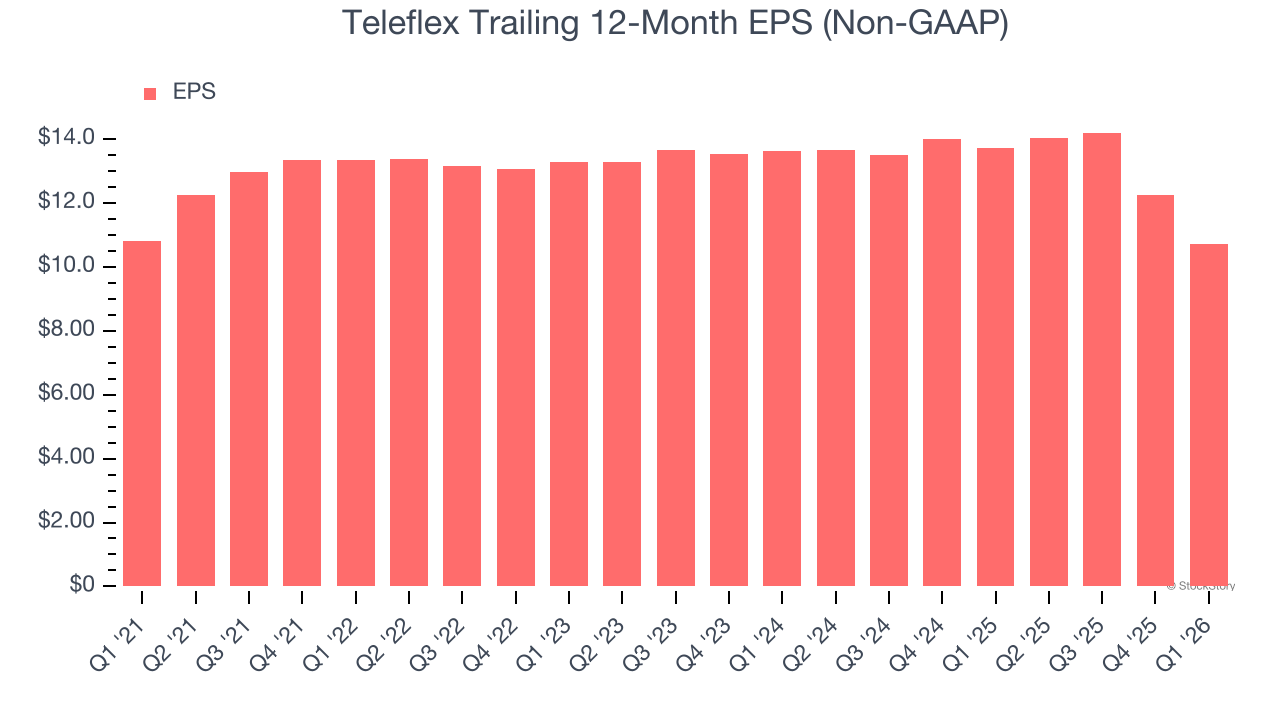
We can take a deeper look into Teleflex’s earnings to better understand the drivers of its performance. A five-year view shows that Teleflex has repurchased its stock, shrinking its share count by 6.6%. This tells us its EPS outperformed its revenue not because of increased operational efficiency but financial engineering, as buybacks boost per share earnings. 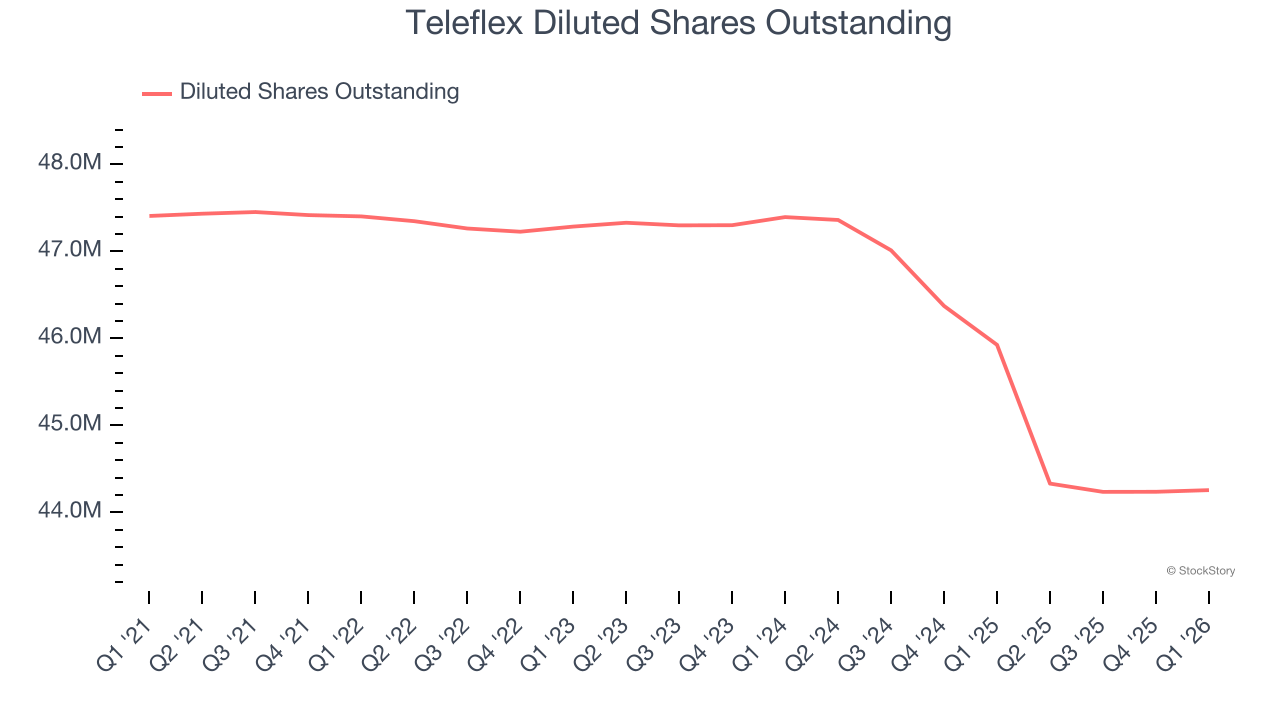
In Q1, Teleflex reported adjusted EPS of $1.39, down from $2.91 in the same quarter last year. Despite falling year on year, this print easily cleared analysts’ estimates. Over the next 12 months, Wall Street expects Teleflex’s full-year EPS of $10.72 to shrink by 28.6%. This is unusual as its revenue and operating margin are anticipated to increase, signaling the fall likely stems from "below-the-line" items such as taxes.
Key Takeaways from Teleflex’s Q1 Results
It was good to see Teleflex beat analysts’ EPS expectations this quarter. We were also glad its revenue outperformed Wall Street’s estimates. On the other hand, its full-year EPS guidance missed. Zooming out, we think this was a mixed quarter. The stock remained flat at $123.21 immediately after reporting.
Is Teleflex an attractive investment opportunity at the current price? If you’re making that decision, you should consider the bigger picture of valuation, business qualities, as well as the latest earnings. We cover that in our actionable full research report which you can read here (it’s free).


