Offshore drilling contractor Seadrill (NYSE: SDRL) reported Q1 CY2026 results exceeding the market’s revenue expectations, with sales up 6.9% year on year to $358 million. Its non-GAAP loss of $0.08 per share was 71.2% above analysts’ consensus estimates.
Is now the time to buy Seadrill? Find out by accessing our full research report, it’s free.
Seadrill (SDRL) Q1 CY2026 Highlights:
- Revenue: $358 million vs analyst estimates of $334 million (6.9% year-on-year growth, 7.2% beat)
- Adjusted EPS: -$0.08 vs analyst estimates of -$0.27 (71.2% beat)
- Adjusted EBITDA: $97 million vs analyst estimates of $66.99 million (27.1% margin, 44.8% beat)
- Operating Margin: 6.7%, up from 5.4% in the same quarter last year
- Free Cash Flow was -$35 million compared to -$72 million in the same quarter last year
- Market Capitalization: $3.02 billion
“Seadrill delivered a solid quarter financially and operationally, including the completion of two major projects ahead of schedule and on budget. These achievements, together with recent commercial success, enhance visibility toward higher earnings and Free Cash Flow(4) in the second half of 2026 and into 2027,” said President and CEO Samir Ali.
Company Overview
Operating in water depths reaching 12,000 feet below the surface, Seadrill (NYSE: SDRL) owns and operates drillships and semi-submersible rigs that drill oil and gas wells in deepwater offshore locations.
Revenue Growth
A company’s long-term performance can give signals about its business quality. Even a bad business, especially in a cyclical industry, can shine for a year or so, but a top-tier one should exhibit resilience through cycles. Over the last five years, Seadrill grew its sales at a sluggish 6.1% compounded annual growth rate. This was below our standard for the energy upstream and integrated energy sector and is a poor baseline for our analysis.
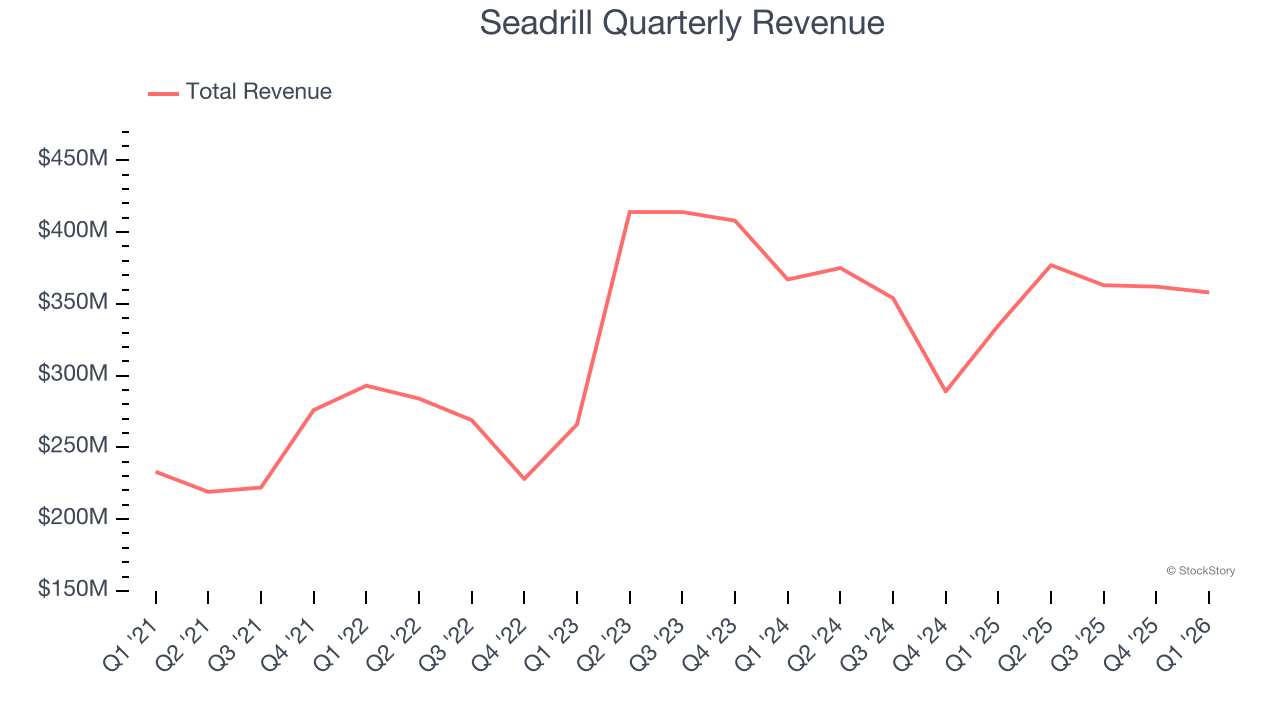
Even a long stretch in Energy can be shaped by a single commodity cycle, so extending the view to ten years adds another perspective and reveals which companies are built to grow regardless of the pricing regime. Seadrill’s performance shows it grew in the past five-year but relinquished its gains over the last ten years, as its revenue fell by 9.6% annually.
This quarter, Seadrill reported year-on-year revenue growth of 6.9%, and its $358 million of revenue exceeded Wall Street’s estimates by 7.2%.
ONE MORE THING: The $21 AI Application Stock Wall Street Forgot. While Wall Street obsesses over who’s building AI, one company is already using it to print money. And nobody’s paying attention.
AI chip stocks trade at ridiculous valuations. This company processes a trillion consumer signals monthly using AI and trades at a third of the price. The gap won’t last. The institutions will figure it out. You need to see this first. Read the FREE Report Before They Notice.
Adjusted EBITDA Margin
Seadrill was profitable over the last five years but held back by its large cost base. Its average EBITDA margin of 23.2% was weak for an upstream and integrated energy business.
On the plus side, Seadrill’s EBITDA margin rose by 17.4 percentage points over the last year.
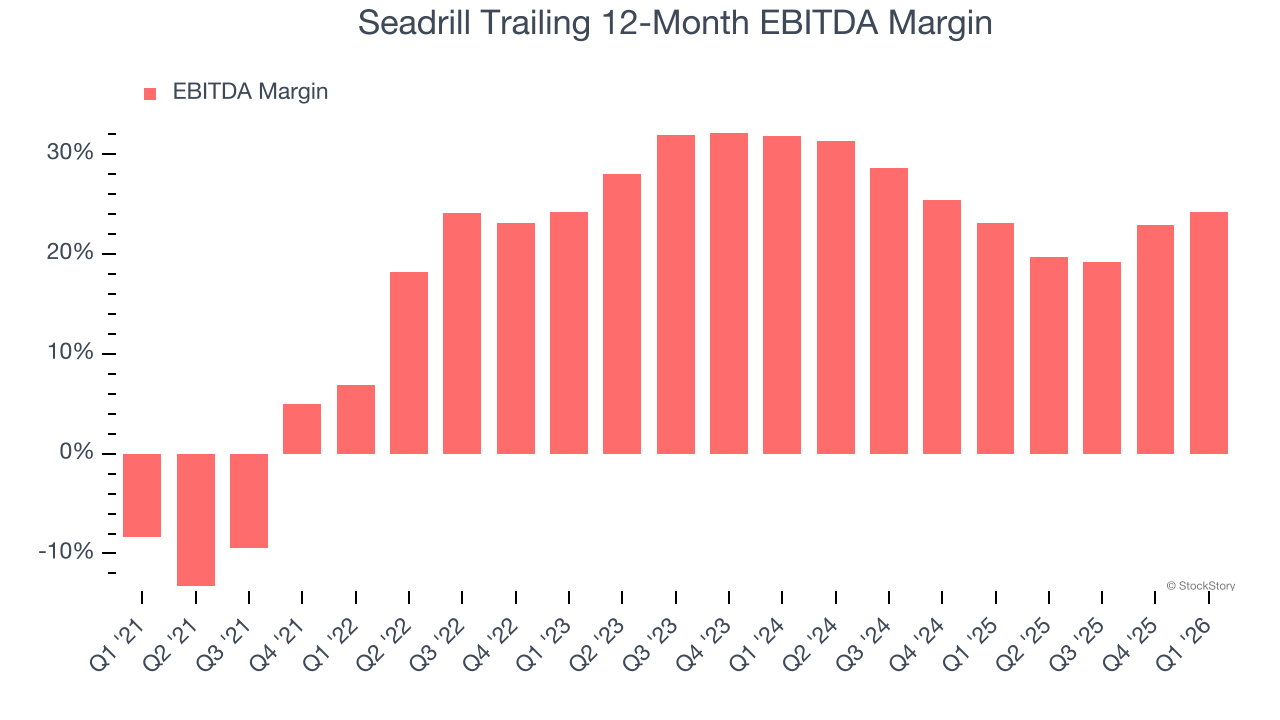
In Q1, Seadrill generated an EBITDA margin profit margin of 27.1%, up 5.3 percentage points year on year. This increase was a welcome development and shows it was more efficient. This adjusted EBITDA beat Wall Street’s estimates by 44.8%.
Cash Is King
Adjusted EBITDA shows how profitable a company’s existing wells are before financing and reinvestment decisions, but free cash flow shows how much value remains after paying the cost of replacing those wells. In upstream energy, production naturally declines over time, so companies must continuously reinvest just to stand still. A producer can report strong EBITDA margins yet generate little or no free cash flow if its wells decline quickly or if new drilling is expensive. Free cash flow therefore captures not only how efficiently a company produces hydrocarbons today, but also how costly it is to sustain that production into the future.
Seadrill’s demanding reinvestments have drained its resources over the last five years, putting it in a pinch and limiting its ability to return capital to investors. Its free cash flow margin averaged negative 5.2%, meaning it lit $5.19 of cash on fire for every $100 in revenue.
The level of free cash flow is important, but its durability across cycles is just as critical. Consistent margins are far more valuable than volatile swings driven by commodity prices.
Seadrill’s ratio of quarterly free cash flow volatility to WTI crude price volatility over the past five years was 21 (lower is better), indicating that its cash generation is far more sensitive to commodity-price swings than most peers. This elevated volatility limits its access to capital in downturns and makes it unlikely to act as a consolidator when weaker competitors come under pressure.
You may be asking why we wait until the free cash flow line to perform this stability analysis versus commodity prices. Why not compare revenue or EBITDA to WTI in the case of Seadrill? Because what ultimately matters is not how much revenue or profit you earn when prices are high but how much cash you can generate when prices are low. Free cash flow is the superior metric because it includes everything from hedging prowess to growth and maintenance capex to management behavior during good times and bad.
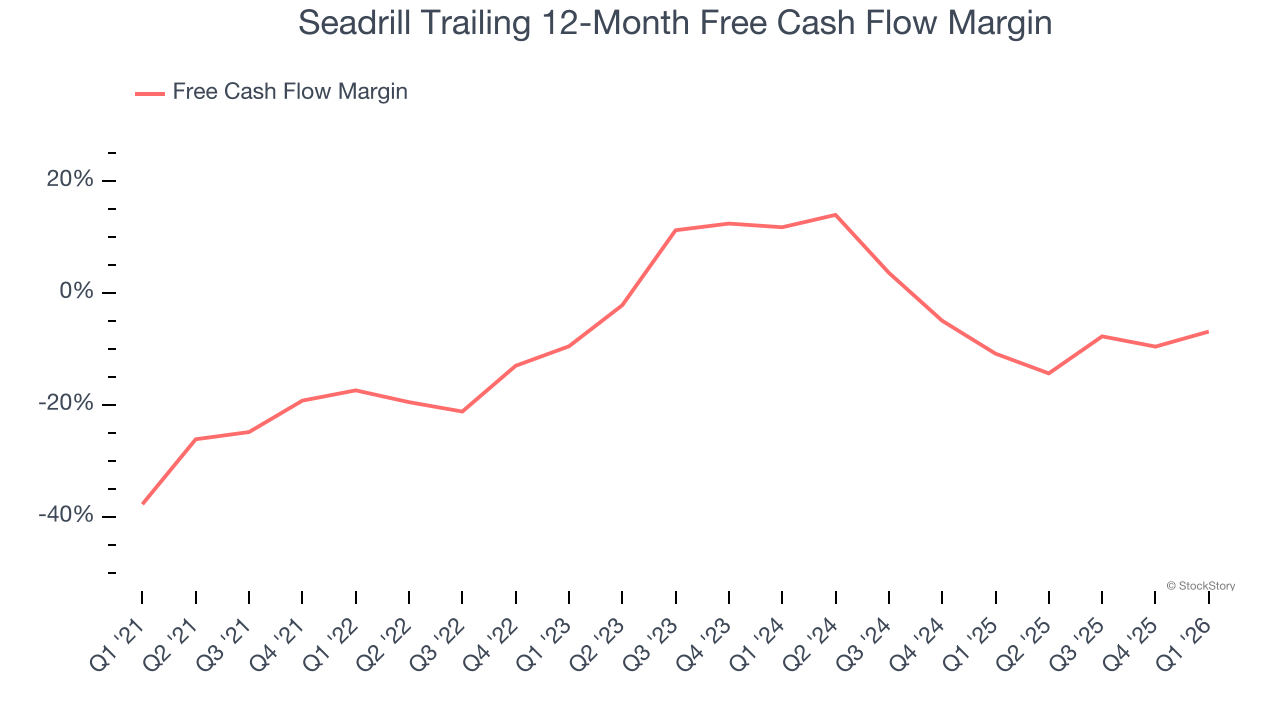
Seadrill burned through $35 million of cash in Q1, equivalent to a negative 9.8% margin. The company’s cash burn slowed from $72 million of lost cash in the same quarter last year.
Key Takeaways from Seadrill’s Q1 Results
It was good to see Seadrill beat analysts’ EPS expectations this quarter. We were also excited its EBITDA outperformed Wall Street’s estimates by a wide margin. Zooming out, we think this was a good print with some key areas of upside. The stock traded up 4.9% to $50.70 immediately after reporting.
Sure, Seadrill had a solid quarter, but if we look at the bigger picture, is this stock a buy? When making that decision, it’s important to consider its valuation, business qualities, as well as what has happened in the latest quarter. We cover that in our actionable full research report which you can read here (it’s free).