
Homebuilder Lennar (NYSE: LEN) fell short of the market’s revenue expectations in Q1 CY2026, with sales falling 13.3% year on year to $6.62 billion. Its GAAP profit of $0.93 per share was 3.2% below analysts’ consensus estimates.
Is now the time to buy Lennar? Find out by accessing our full research report, it’s free.
Lennar (LEN) Q1 CY2026 Highlights:
- Revenue: $6.62 billion vs analyst estimates of $6.93 billion (13.3% year-on-year decline, 4.5% miss)
- EPS (GAAP): $0.93 vs analyst expectations of $0.96 (3.2% miss)
- Operating Margin: 5.1%, down from 9.1% in the same quarter last year
- Backlog: $6 billion at quarter end, up 3.4% year on year
- Market Capitalization: $23.74 billion
Stuart Miller, Executive Chairman and Chief Executive Officer of Lennar, said, "Our first quarter of fiscal year 2026 was defined by the same persistent headwinds that have challenged the housing market for over three years — high mortgage rates, constrained affordability, cautious consumer sentiment, and geopolitical uncertainty, especially now including the recent conflict in Iran. As our results reflect, Lennar remained focused on executing our consistent operating strategy to maintain production and support housing supply, while driving structural improvements across our business."
Company Overview
One of the largest homebuilders in America, Lennar (NYSE: LEN) is known for constructing affordable, move-up, and retirement homes across a range of markets and communities.
Revenue Growth
A company’s long-term sales performance is one signal of its overall quality. Even a bad business can shine for one or two quarters, but a top-tier one grows for years. Over the last five years, Lennar grew its sales at a mediocre 7.3% compounded annual growth rate. This fell short of our benchmark for the industrials sector and is a rough starting point for our analysis.
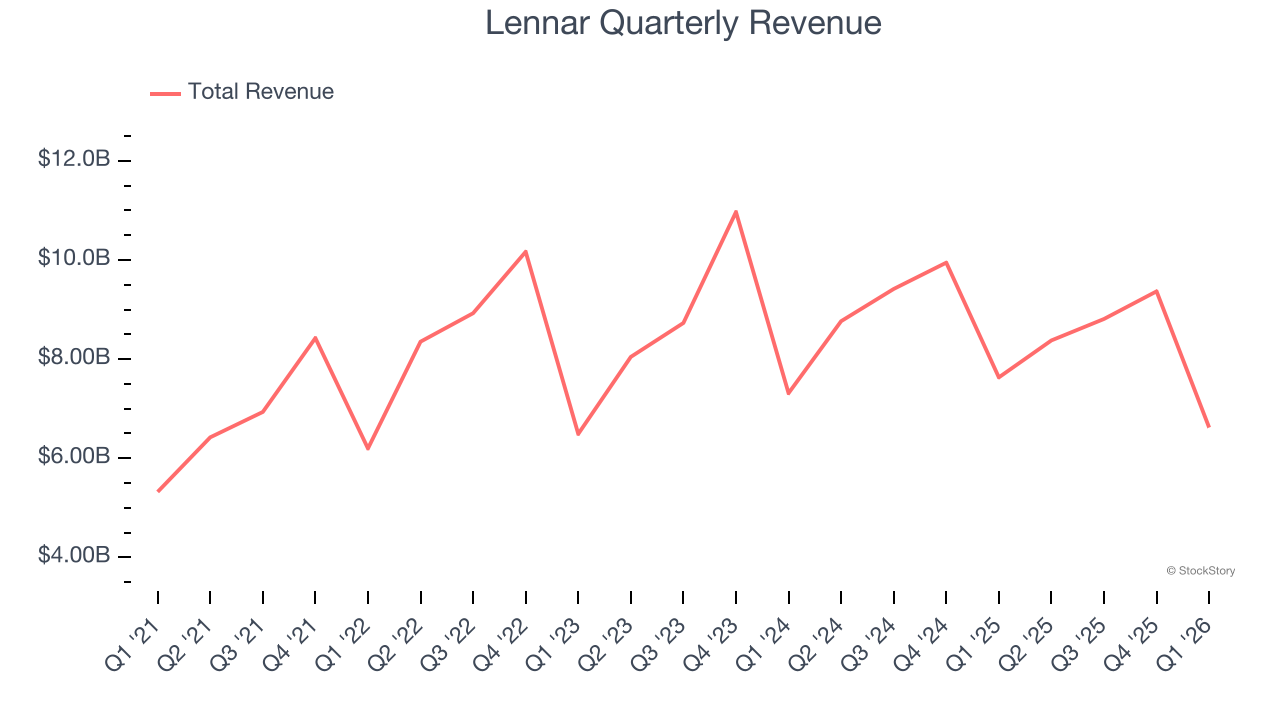
Long-term growth is the most important, but within industrials, a half-decade historical view may miss new industry trends or demand cycles. Lennar’s performance shows it grew in the past but relinquished its gains over the last two years, as its revenue fell by 2.7% annually. 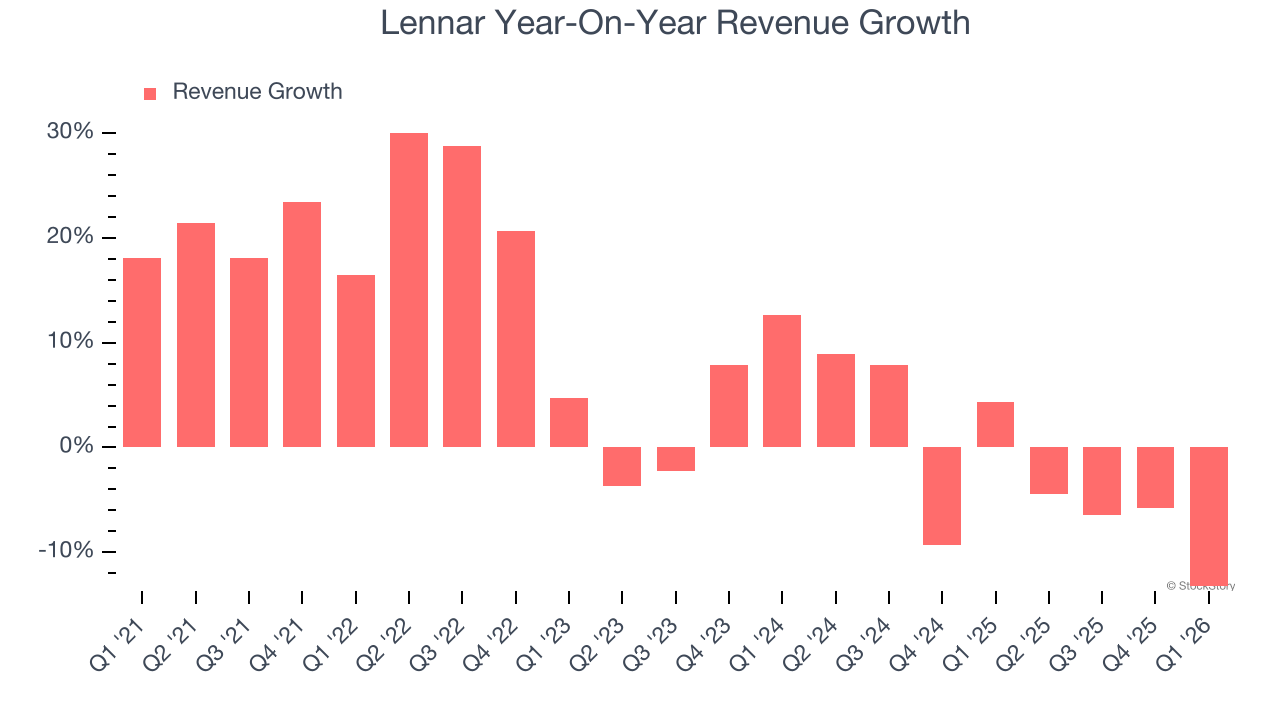
Lennar also reports its backlog, or the value of its outstanding orders that have not yet been executed or delivered. Lennar’s backlog reached $6 billion in the latest quarter and averaged 11.4% year-on-year declines over the last two years. Because this number is lower than its revenue growth, we can see the company hasn’t secured enough new orders to maintain its growth rate in the future. 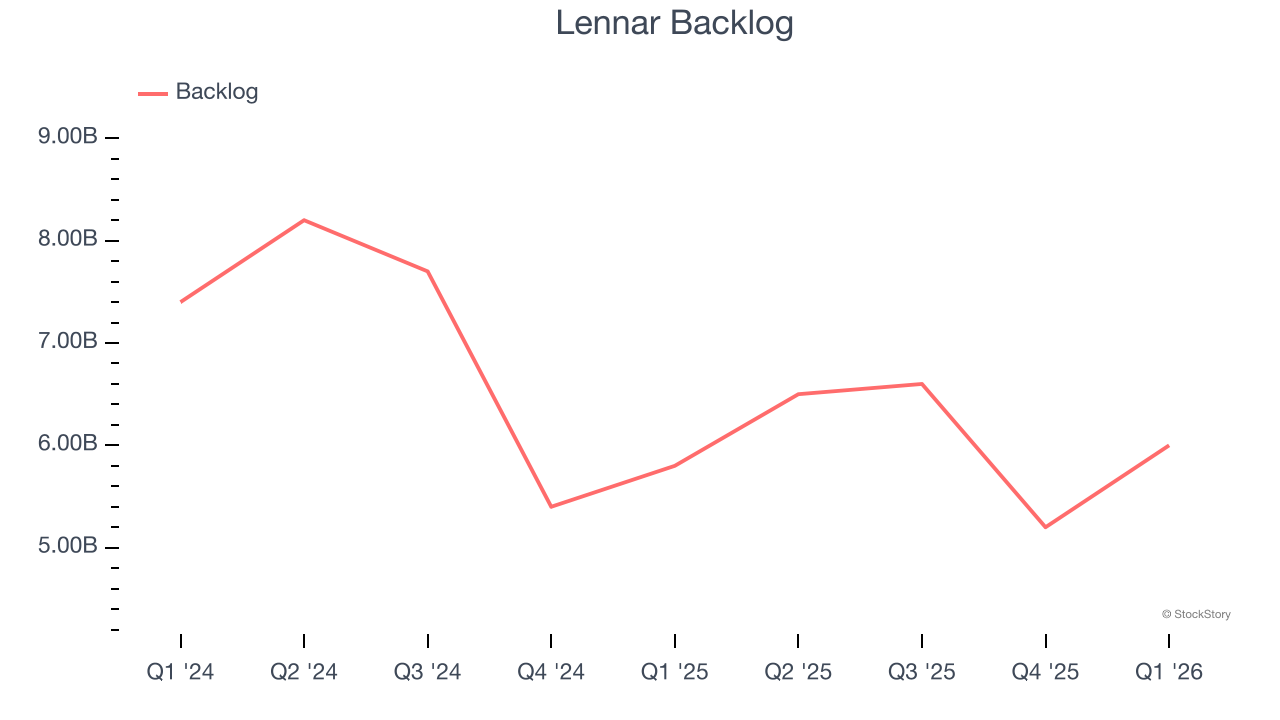
This quarter, Lennar missed Wall Street’s estimates and reported a rather uninspiring 13.3% year-on-year revenue decline, generating $6.62 billion of revenue.
Looking ahead, sell-side analysts expect revenue to grow 2.4% over the next 12 months. While this projection implies its newer products and services will fuel better top-line performance, it is still below the sector average.
WHILE YOU’RE HERE: The Next Palantir? One satellite company captures images of every point on Earth. Every single day. The Pentagon wants it. Hedge funds are using it to beat earnings. You’ve probably never heard of it.
This is what the early days of Palantir looked like before it became a $437 billion giant. Same playbook. Different technology. If you missed Palantir, you need to see this. Claim The Stock Ticker for Free HERE.
Operating Margin
Operating margin is a key measure of profitability. Think of it as net income - the bottom line - excluding the impact of taxes and interest on debt, which are less connected to business fundamentals.
Lennar has been an efficient company over the last five years. It was one of the more profitable businesses in the industrials sector, boasting an average operating margin of 14.5%. This result was particularly impressive because of its low gross margin, which is mostly a factor of what it sells and takes huge shifts to move meaningfully. Companies have more control over their operating margins, and it’s a show of well-managed operations if they’re high when gross margins are low.
Looking at the trend in its profitability, Lennar’s operating margin decreased by 12 percentage points over the last five years. This raises questions about the company’s expense base because its revenue growth should have given it leverage on its fixed costs, resulting in better economies of scale and profitability.
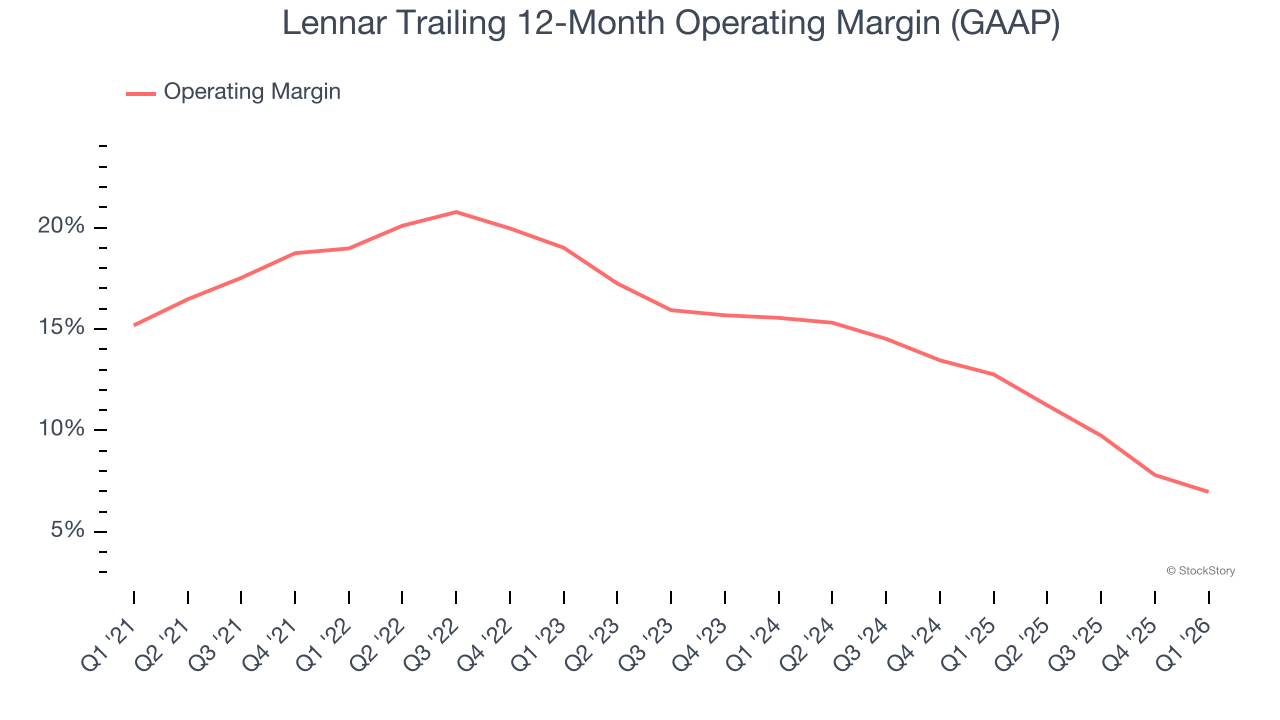
In Q1, Lennar generated an operating margin profit margin of 5.1%, down 4 percentage points year on year. Since Lennar’s operating margin decreased more than its gross margin, we can assume it was less efficient because expenses such as marketing, R&D, and administrative overhead increased.
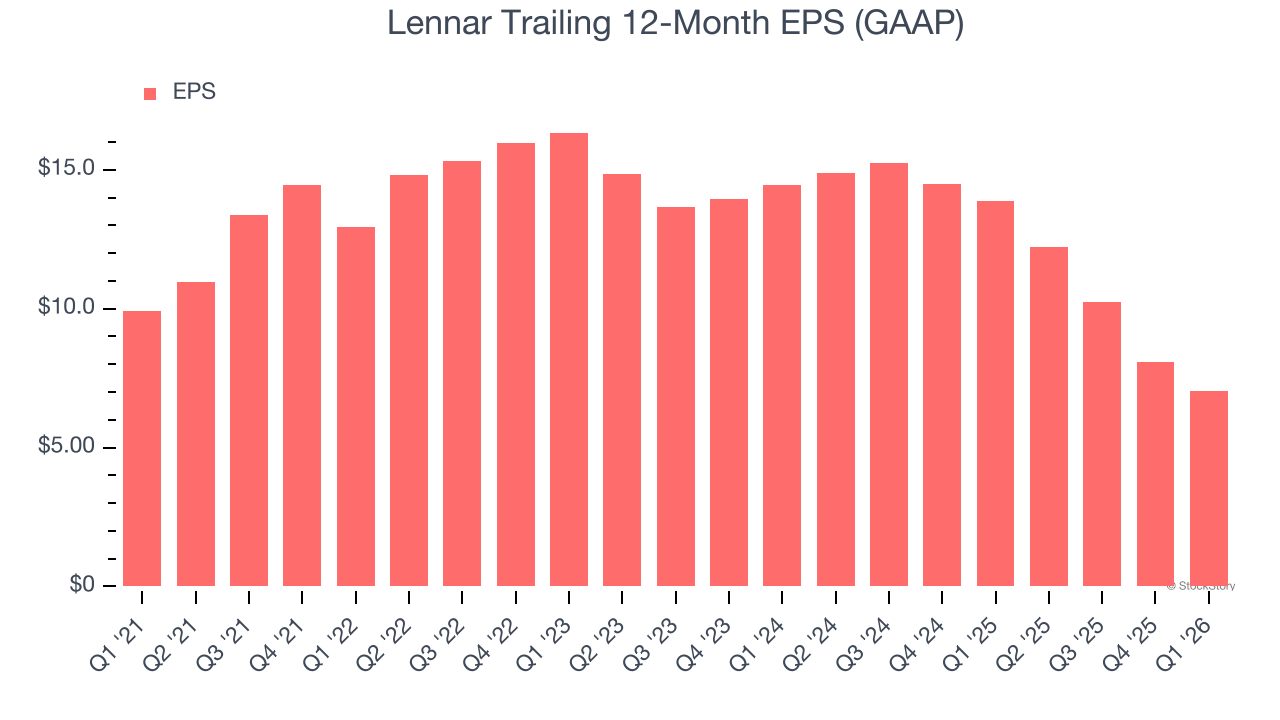
Earnings Per Share
We track the long-term change in earnings per share (EPS) for the same reason as long-term revenue growth. Compared to revenue, however, EPS highlights whether a company’s growth is profitable.
Sadly for Lennar, its EPS declined by 6.7% annually over the last five years while its revenue grew by 7.3%. This tells us the company became less profitable on a per-share basis as it expanded due to non-fundamental factors such as interest expenses and taxes.
We can take a deeper look into Lennar’s earnings to better understand the drivers of its performance. As we mentioned earlier, Lennar’s operating margin declined by 12 percentage points over the last five years. This was the most relevant factor (aside from the revenue impact) behind its lower earnings; interest expenses and taxes can also affect EPS but don’t tell us as much about a company’s fundamentals.
Like with revenue, we analyze EPS over a shorter period to see if we are missing a change in the business.
For Lennar, its two-year annual EPS declines of 30.3% show it’s continued to underperform. These results were bad no matter how you slice the data.
In Q1, Lennar reported EPS of $0.93, down from $1.98 in the same quarter last year. This print missed analysts’ estimates. Over the next 12 months, Wall Street expects Lennar’s full-year EPS of $7.02 to grow 2.3%.
Key Takeaways from Lennar’s Q1 Results
We struggled to find many positives in these results. Its revenue missed and its EPS fell short of Wall Street’s estimates. Overall, this was a softer quarter. The stock traded down 1.1% to $92.25 immediately following the results.
Lennar’s latest earnings report disappointed. One quarter doesn’t define a company’s quality, so let’s explore whether the stock is a buy at the current price. If you’re making that decision, you should consider the bigger picture of valuation, business qualities, as well as the latest earnings. We cover that in our actionable full research report which you can read here (it’s free).