Home and security products company Fortune Brands (NYSE: FBIN) missed Wall Street’s revenue expectations in Q3 2026, with revenue falling 3.1% year on year to $1.11 billion. Its non-GAAP profit of $1.14 per share was 54.5% above analysts’ consensus estimates.
For more on Fortune Brands, read the full research report, available free.
Fortune Brands (FBIN) Q3 2026 highlights:
- Revenue $1.11 billion vs S&P analysts’ consensus estimates of $1.13 billion (3.1% year-on-year decline, 1% miss)
- Adjusted EPS $1.14 vs S&P analysts’ consensus estimates of $0.74 (54.5% beat)
- Adjusted EBITDA $196.5 million vs analysts’ consensus estimates of $187.1 million (17.6% margin, 5% beat)
- Operating margin 5.4%, down from 11% in the same quarter last year
- Free cash flow margin 29.7%, up from 15.4% in the same quarter last year
- Market capitalization $5.56 billion
“Fortune Brands is in the early stages of a multi-year turnaround plan to get Back to Business. We are building from a strong foundation of brands that consumers and pros know and trust. Third quarter results were in line with our outlook excluding the tax and tariff benefits, but not where they need to be. Our biggest challenge has been our own execution, and we are taking aggressive steps to drive improvement,” said Fortune Brands Chief Executive Officer Jesse Singh.
Revenue growth
A company’s long-term performance is an indicator of its overall quality. Any business can have short-term success, but a top-tier one grows for years. Fortune Brands’s demand was weak over the last five years as its revenue fell at a 3.6% annual rate. This was below our standards and is a sign of poor business quality.
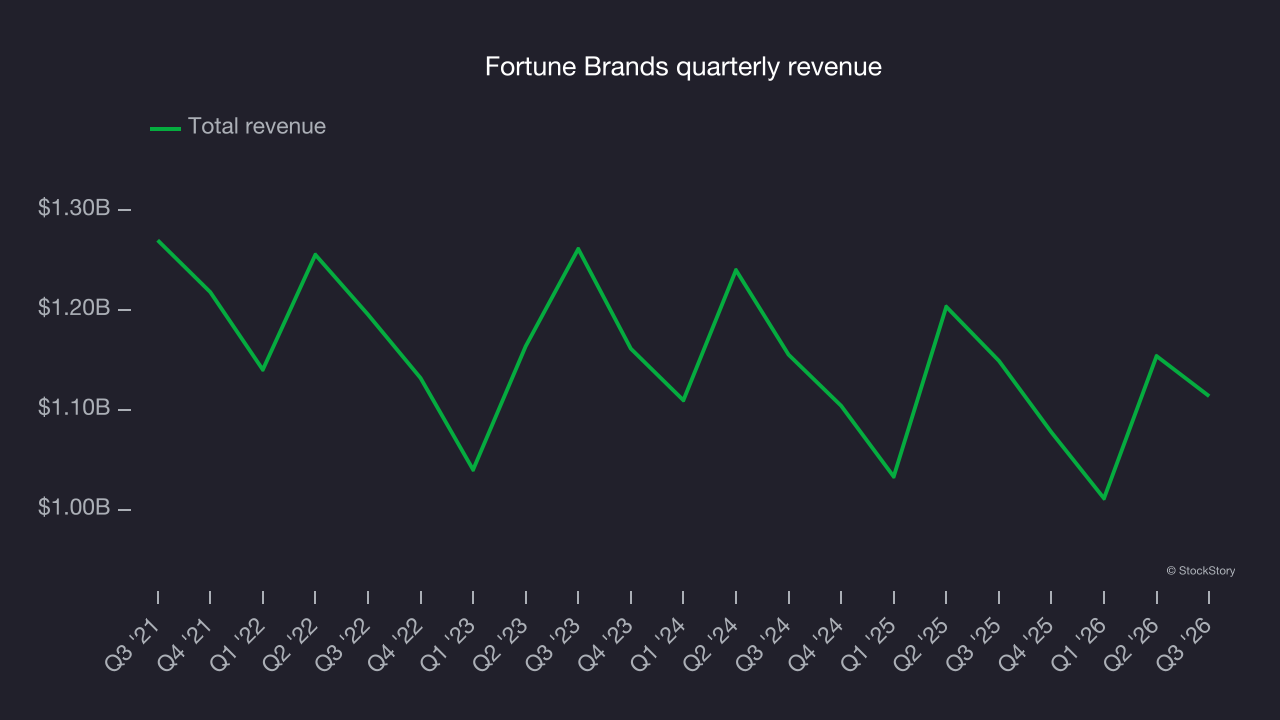
Long-term growth matters most, but within industrials, a half-decade historical view may miss cycles, industry trends or a company capitalizing on catalysts such as a new contract win or a successful product line. Fortune Brands’s annualized revenue declines of 3.4% over the last two years align with its five-year trend, suggesting its demand has consistently shrunk. 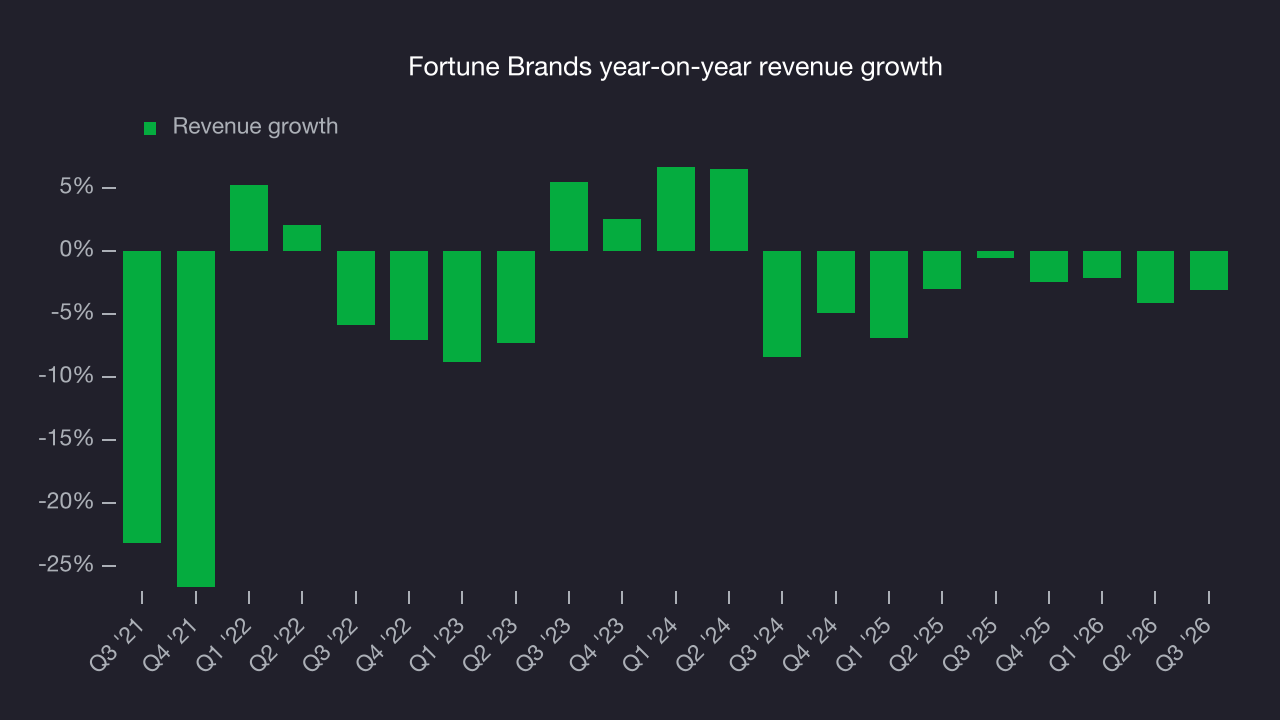
This quarter, Fortune Brands missed Wall Street’s consensus estimates and reported an uninspiring 3.1% year-on-year revenue decline, generating $1.11 billion of revenue.
Looking ahead, sell-side analysts expect revenue to remain flat over the next 12 months, according to S&P. Although this projection indicates its newer products and services will improve revenue performance, it is still below average for the sector.
Operating margin
Fortune Brands has been an efficient company over the last five years. It was one of the more profitable businesses in the industrials sector, with an average operating margin of 12.9%. That outcome is unsurprising given its favorable gross margin baseline.
Looking at the trend in its profitability, Fortune Brands’s operating margin decreased by 11.1 percentage points over the last five years. Even though its historical margin was healthy, shareholders will want to see Fortune Brands become more profitable in the future.
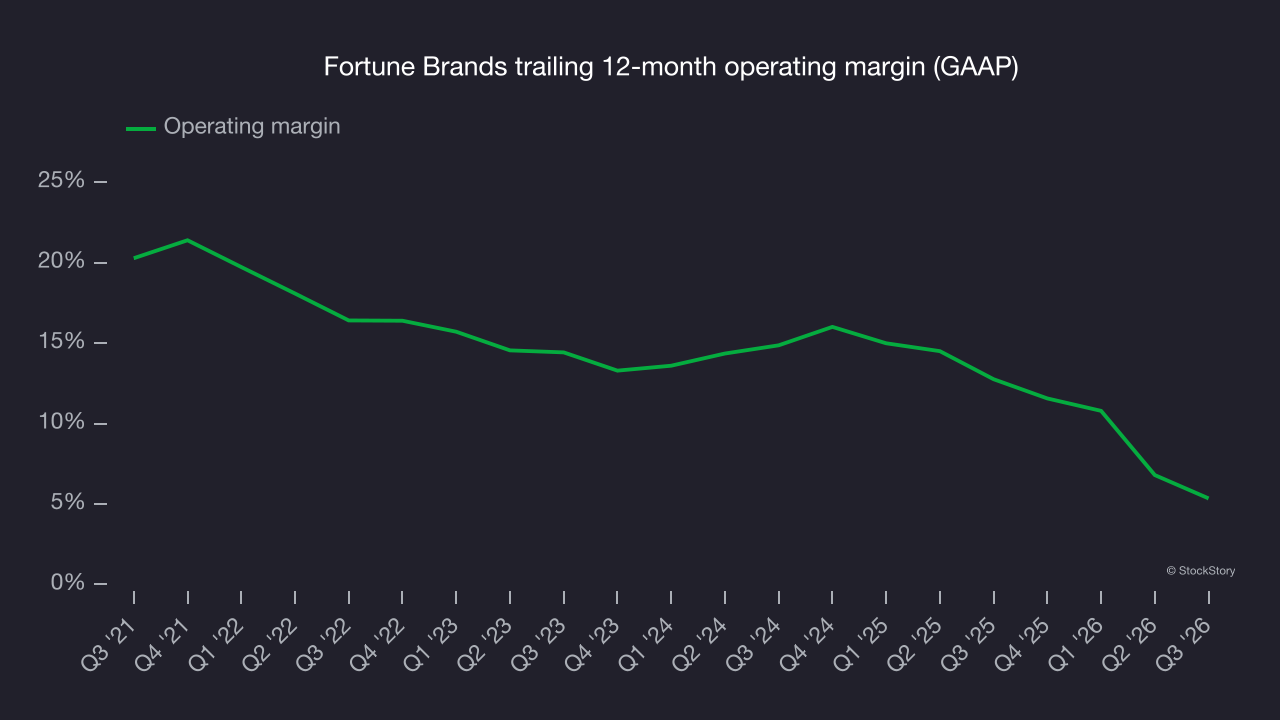
This quarter, Fortune Brands generated an operating margin of 5.4%, down 5.5 percentage points year on year. Its operating margin decreased more than its gross margin, suggesting it was less efficient as expenses such as marketing, research and development and administrative overhead increased.
Earnings per share
We track the long-term change in earnings per share (EPS) for the same reason as long-term revenue growth. Compared to revenue, however, EPS highlights whether a company’s growth is profitable.
Fortune Brands’s EPS declined by 7.3% annually over the last five years, more than its revenue. The company struggled because its fixed cost base made it difficult to adjust to shrinking demand.
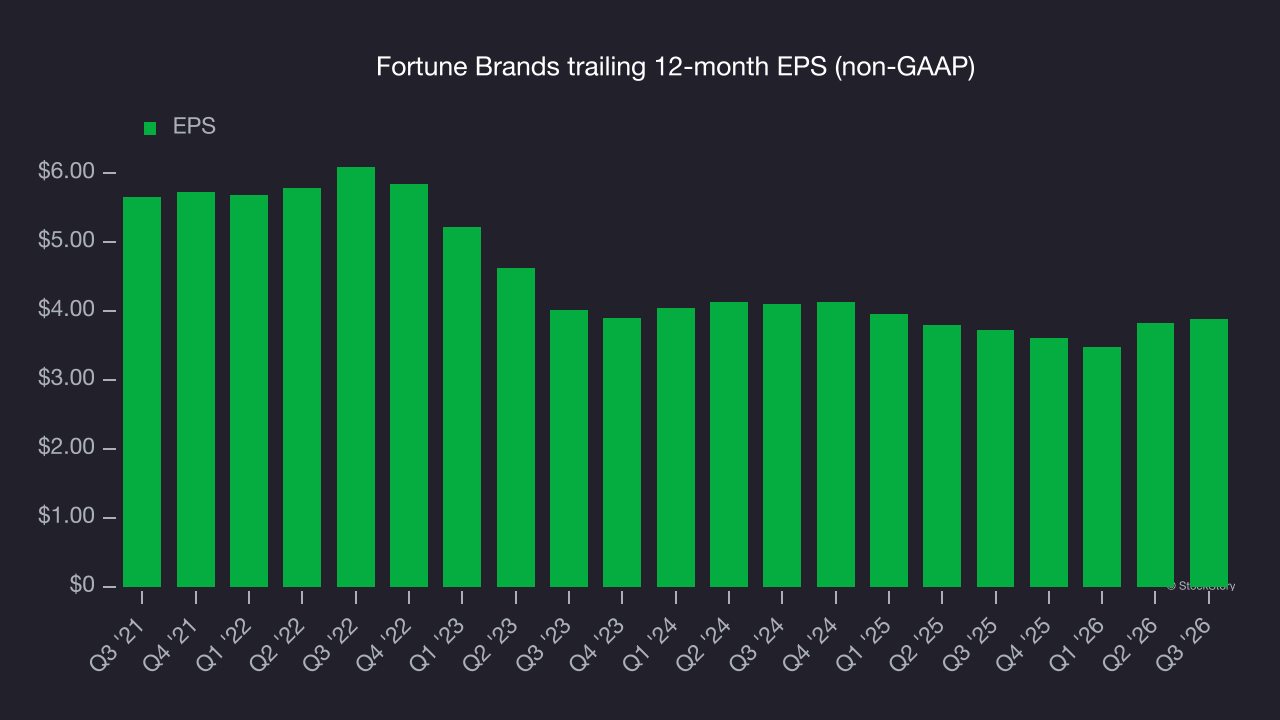
A closer look at Fortune Brands’s earnings helps explain its performance. As noted earlier, Fortune Brands’s operating margin declined by 11.1 percentage points over the last five years. This was the most relevant factor (aside from the revenue impact) behind its lower earnings; interest expenses and taxes can also affect EPS but don’t tell us as much about a company’s fundamentals.
As with revenue, we analyze EPS over a more recent period because it can provide insight into an emerging theme or development for the business.
For Fortune Brands, its two-year annual EPS declines of 2.7% show it’s still underperforming. These results were poor regardless of the period examined.
In Q3, Fortune Brands reported adjusted EPS of $1.14, up from $1.09 in the same quarter last year. EPS came in well above analysts’ consensus estimates, a positive result for shareholders. Over the next 12 months, Wall Street expects Fortune Brands’s full-year EPS to shrink by 18.9% from $3.88 to $3.15, according to S&P.
Key takeaways from Fortune Brands’s Q3 results
Fortune Brands delivered a solid quarter, with EPS and EBITDA topping analysts’ consensus estimates despite a slight revenue miss. Shares rose 4.7% to $45.65 immediately after the results.
Fortune Brands reported solid earnings, but one quarter doesn’t necessarily make the stock a buy. The latest quarter is only one part of assessing longer-term business quality. Quality, combined with valuation, can help determine whether the stock is a buy. For more on Fortune Brands, read the free full research report here.