Global manufacturing solutions provider Flex (NASDAQ: FLEX) beat Wall Street’s revenue expectations in calendar Q3 2026 (fiscal Q2 2027), with revenue up 24.8% year on year to $8.49 billion. The company expects next quarter’s revenue to be around $9.02 billion, close to analysts’ consensus estimates. Its non-GAAP profit of $1.18 per share was 11.5% above analysts’ consensus estimates.
For more on Flex, read our free full research report.
Flex (FLEX) Q3 CY2026 highlights:
- Revenue $8.49 billion vs S&P analysts’ consensus estimates of $8.15 billion (24.8% year-on-year growth, 4.2% beat)
- Adjusted EPS $1.18 vs S&P analysts’ consensus estimates of $1.06 (11.5% beat)
- Revenue guidance The company lifted its revenue guidance for the full year to $35.4 billion at the midpoint from $34.45 billion, a 2.8% increase
- Adjusted EPS guidance Management raised its full-year adjusted EPS guidance to $5 at the midpoint, a 9.2% increase
- Operating margin 4.9%, in line with the same quarter last year
- Free cash flow margin 3.1%, down from 4.5% in the same quarter last year
- Market capitalization $30.79 billion
"We continue to execute from a position of strength while advancing our planned spin-off of our Cloud and Power Infrastructure segment. Our acquisition of EPC Power further completes our end-to-end Power portfolio and will be immediately accretive in fiscal 2027, while the unveiling of the Axiom name and anticipated leadership marks another important step toward creating two focused companies positioned for long-term success," said Revathi Advaithi, CEO of Flex.
Revenue growth
A company’s long-term performance is an indicator of its overall quality. Any business can have short-term success, but a top-tier one grows for years.
With $30.95 billion in revenue over the past 12 months, Flex is a large company in the business services sector and benefits from economies of scale, giving it an edge in distribution. This also gives it more leverage on its fixed costs than smaller competitors and flexibility to offer lower prices. However, its scale is a double-edged sword because it’s harder to find incremental growth when you’ve penetrated most of the market. To expand meaningfully, Flex likely needs to adjust its prices, innovate with new offerings or enter new markets.
Flex’s revenue grew at a tepid 3.9% compounded annual growth rate over the last five years. This shows it failed to generate significant demand.
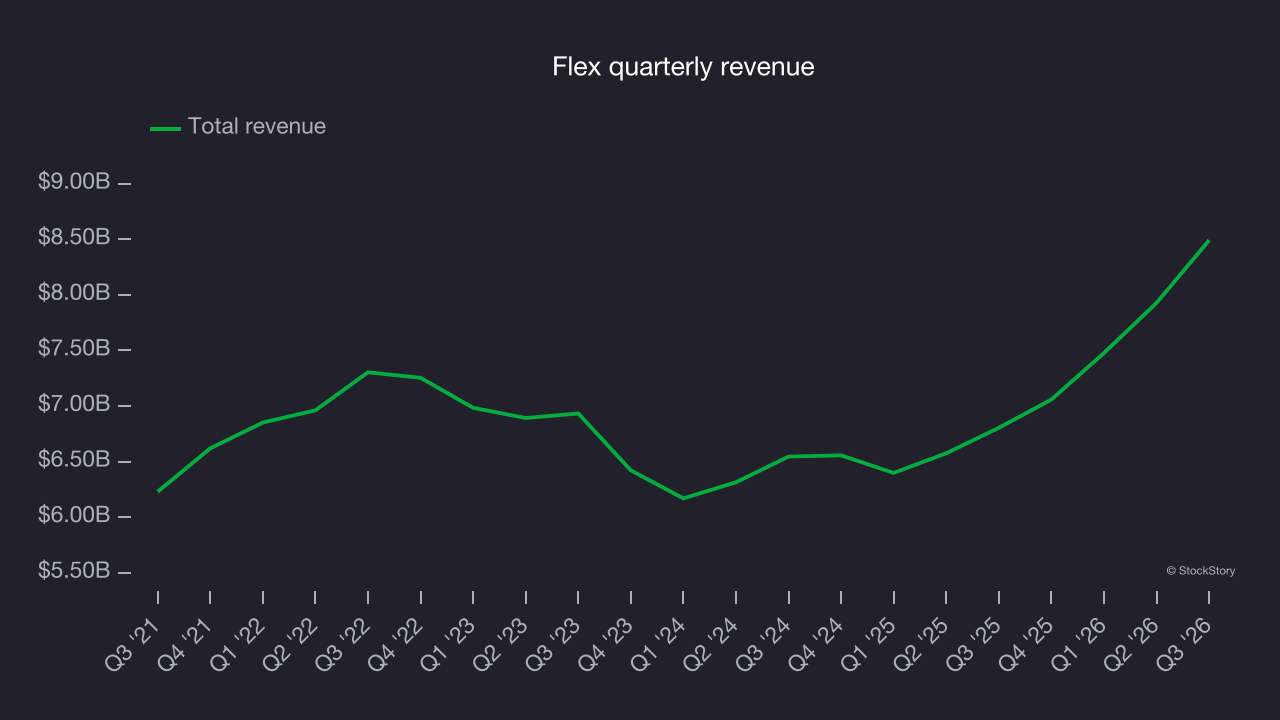
Long-term growth is the most important, but within business services, a half-decade historical view may miss new innovations or demand cycles. Flex’s annualized revenue growth of 10.3% over the last two years is above its five-year trend, suggesting its demand recently accelerated. 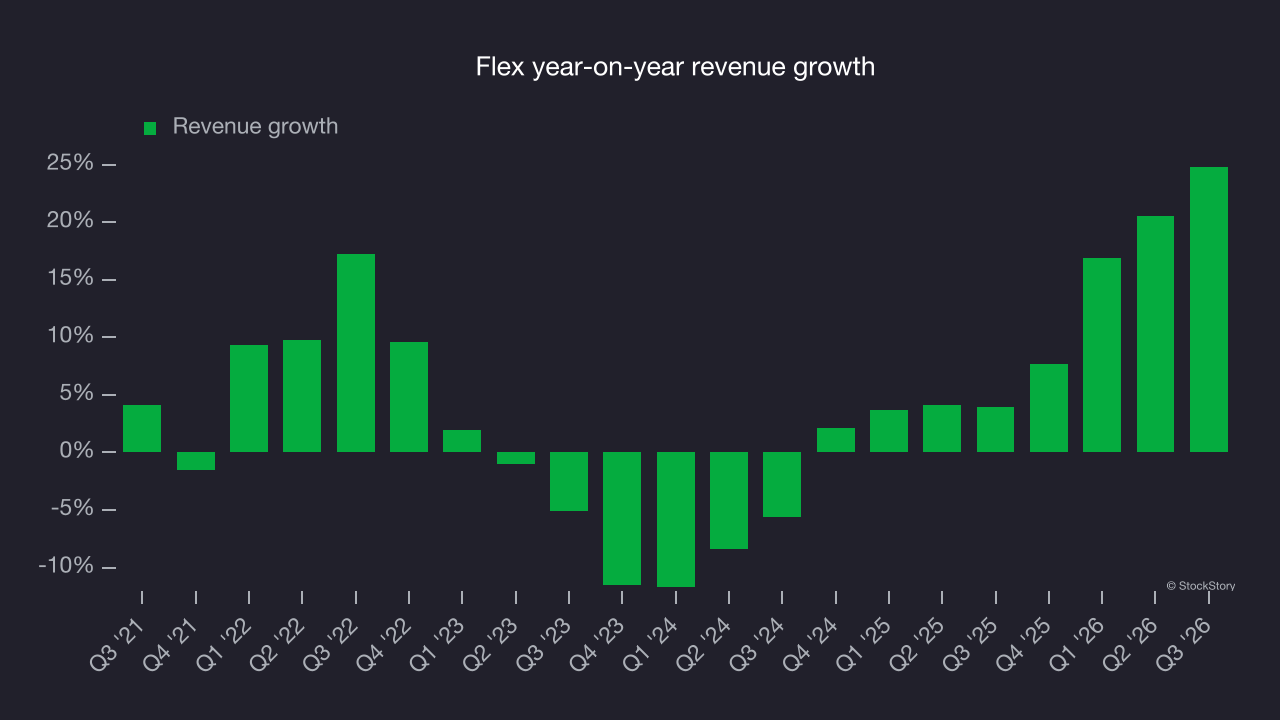
This quarter, Flex reported year-on-year revenue growth of 24.8%, and its $8.49 billion in revenue topped Wall Street’s consensus estimates by 4.2%. Company management is currently guiding for a 27.8% year-on-year increase in revenue next quarter.
Looking further ahead, sell-side analysts expect revenue to grow 27.3% over the next 12 months, according to S&P, an improvement versus the last two years. This projection is strong for a company of its scale and indicates its newer products and services will drive better revenue performance.
Adjusted operating margin
Flex was profitable over the last five years but held back by its large cost base. Its average adjusted operating margin of 5.3% was weak for a business services company.
On the positive side, Flex’s adjusted operating margin rose by 1.9 percentage points over the last five years, as its revenue growth provided operating leverage.
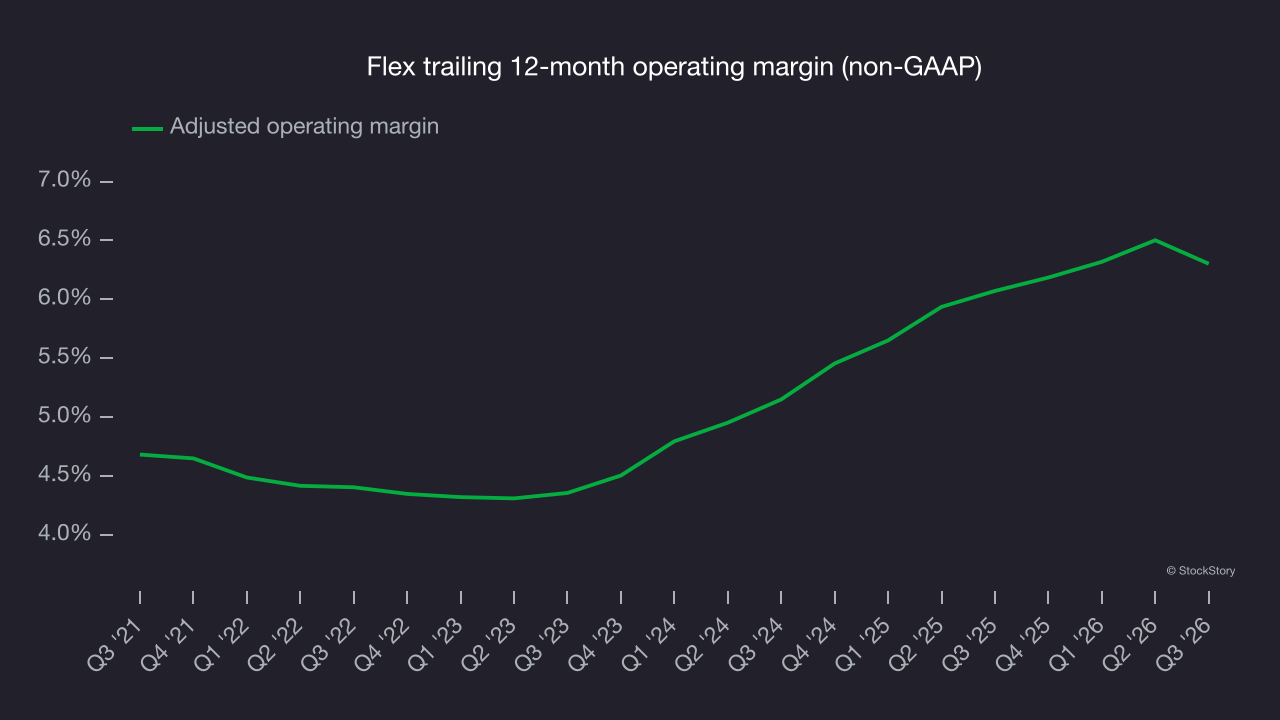
In Q3, Flex generated an adjusted operating margin of 5.4%, in line with the same quarter last year. This indicates the company’s overall cost structure has been relatively stable.
Earnings per share
We track the long-term change in earnings per share (EPS) for the same reason as long-term revenue growth. Compared to revenue, however, EPS highlights whether a company’s growth is profitable.
Flex’s EPS grew at a 15.7% compounded annual growth rate over the last five years, higher than its 3.9% annualized revenue growth. This indicates the company became more profitable on a per-share basis as it expanded.
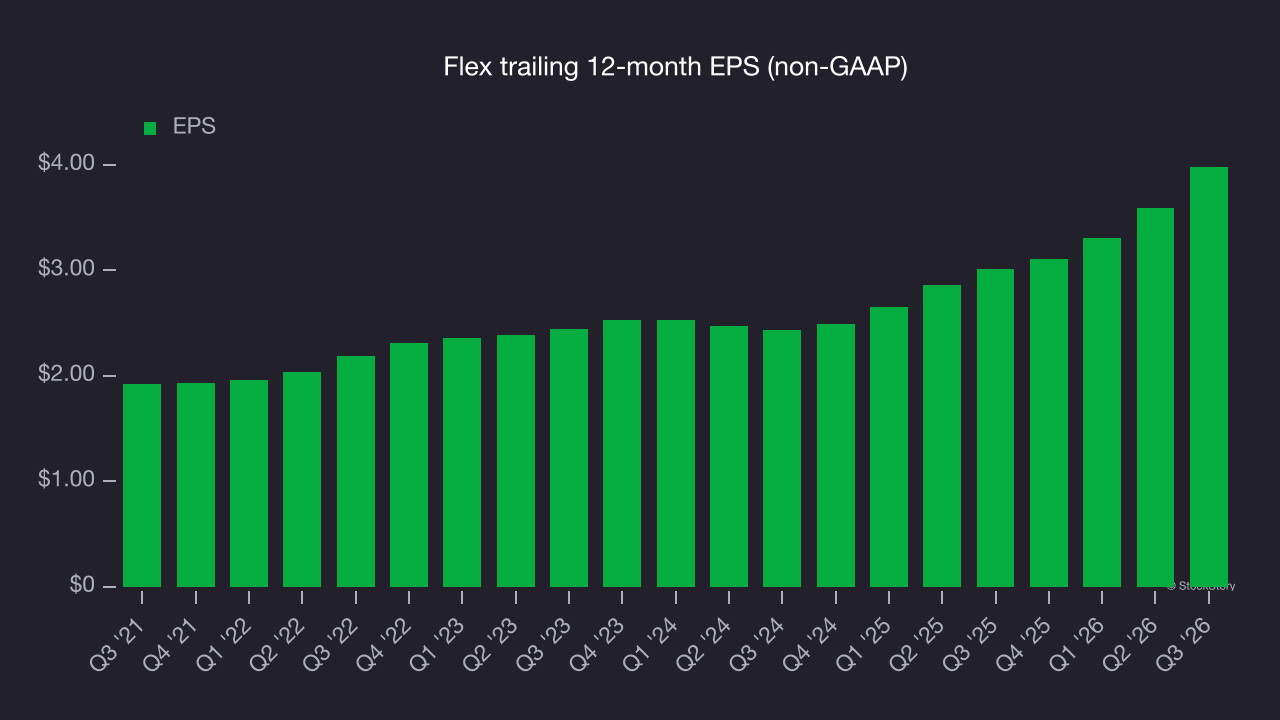
A closer look at Flex’s earnings quality helps explain the drivers of its performance. As mentioned earlier, Flex’s adjusted operating margin was flat this quarter but expanded by 1.9 percentage points over the last five years. In addition, its share count shrank by 23.2%. These are positive signs for shareholders because improving profitability and share buybacks boost EPS growth relative to revenue growth. 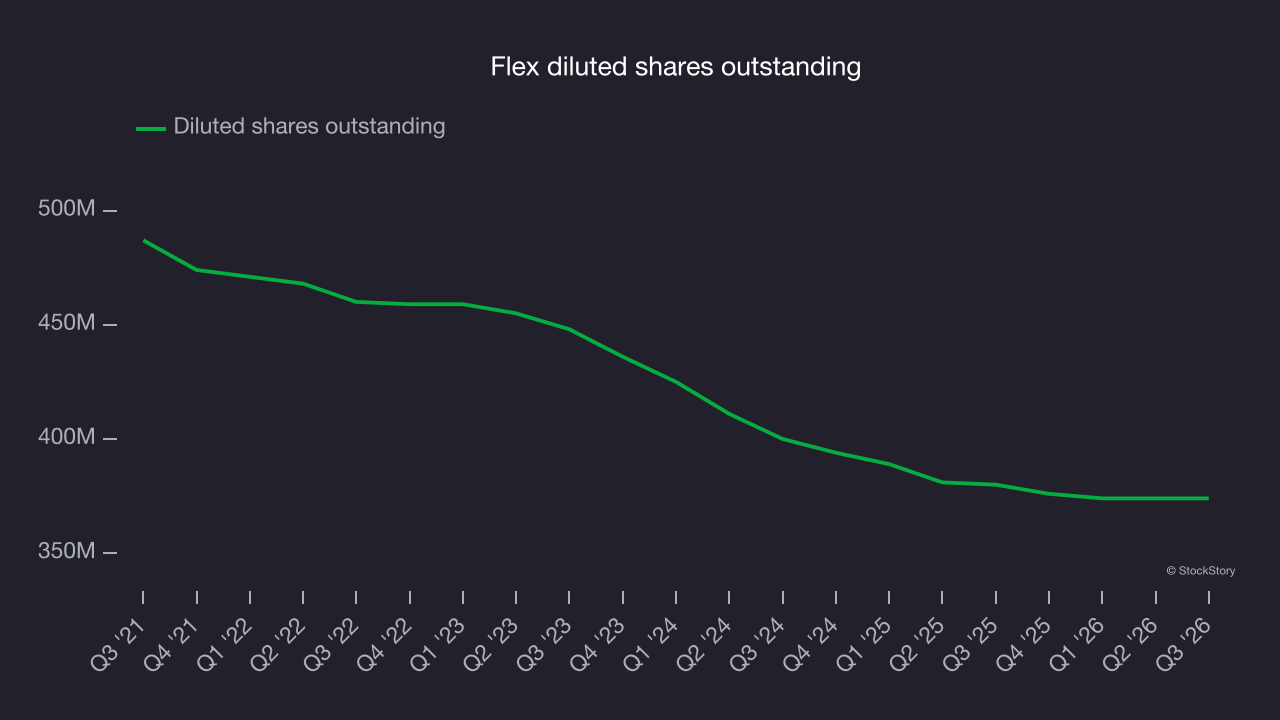
Like with revenue, we analyze EPS over a shorter period to see if we are missing a change in the business.
For Flex, its two-year annual EPS growth of 28% was higher than its five-year trend. That acceleration is a positive sign, particularly given the already high base.
In Q3, Flex reported adjusted EPS of $1.18, up from $0.79 in the same quarter last year. This result comfortably beat analysts’ consensus estimates, a favorable outcome for shareholders. There is insufficient data to analyze expected EPS growth based on Wall Street analysts’ consensus projections.
Key takeaways from Flex’s Q3 results
Flex delivered a solid quarter, with full-year EPS guidance well above analysts’ consensus estimates and revenue ahead of Wall Street’s expectations. Shares surged 8.9% to $91.13 immediately after the results.
Flex may have had a good quarter, but investment decisions depend on more than recent results. The latest quarter matters, but not nearly as much as longer-term fundamentals and valuation when deciding whether to buy the stock. Read the full research report here (it’s free).