
Financial services giant PNC (NYSE: PNC) reported Q4 CY2025 results beating Wall Street’s revenue expectations, with sales up 8.5% year on year to $6.07 billion. Its GAAP profit of $4.88 per share was 15.9% above analysts’ consensus estimates.
Is now the time to buy PNC Financial Services Group? Find out by accessing our full research report, it’s free.
PNC Financial Services Group (PNC) Q4 CY2025 Highlights:
- Net Interest Income: $3.73 billion vs analyst estimates of $3.73 billion (5.9% year-on-year growth, in line)
- Net Interest Margin: 2.8% vs analyst estimates of 2.8% (in line)
- Revenue: $6.07 billion vs analyst estimates of $5.97 billion (8.5% year-on-year growth, 1.7% beat)
- Efficiency Ratio: 59% vs analyst estimates of 59.2% (16.3 basis point beat)
- EPS (GAAP): $4.88 vs analyst estimates of $4.21 (15.9% beat)
- Tangible Book Value per Share: $112.51 vs analyst estimates of $109.91 (18% year-on-year growth, 2.4% beat)
- Market Capitalization: $84.33 billion
Company Overview
Tracing its roots back to 1852 when Pittsburgh's industrial boom demanded stronger financial institutions, PNC (NYSE: PNC) is a diversified financial institution that provides retail banking, corporate banking, and asset management services through a coast-to-coast branch network.
Sales Growth
In general, banks make money from two primary sources. The first is net interest income, which is interest earned on loans, mortgages, and investments in securities minus interest paid out on deposits. The second source is non-interest income, which can come from bank account, credit card, wealth management, investing banking, and trading fees. Over the last five years, PNC Financial Services Group grew its revenue at a tepid 6.2% compounded annual growth rate. This fell short of our benchmark for the banking sector and is a poor baseline for our analysis.
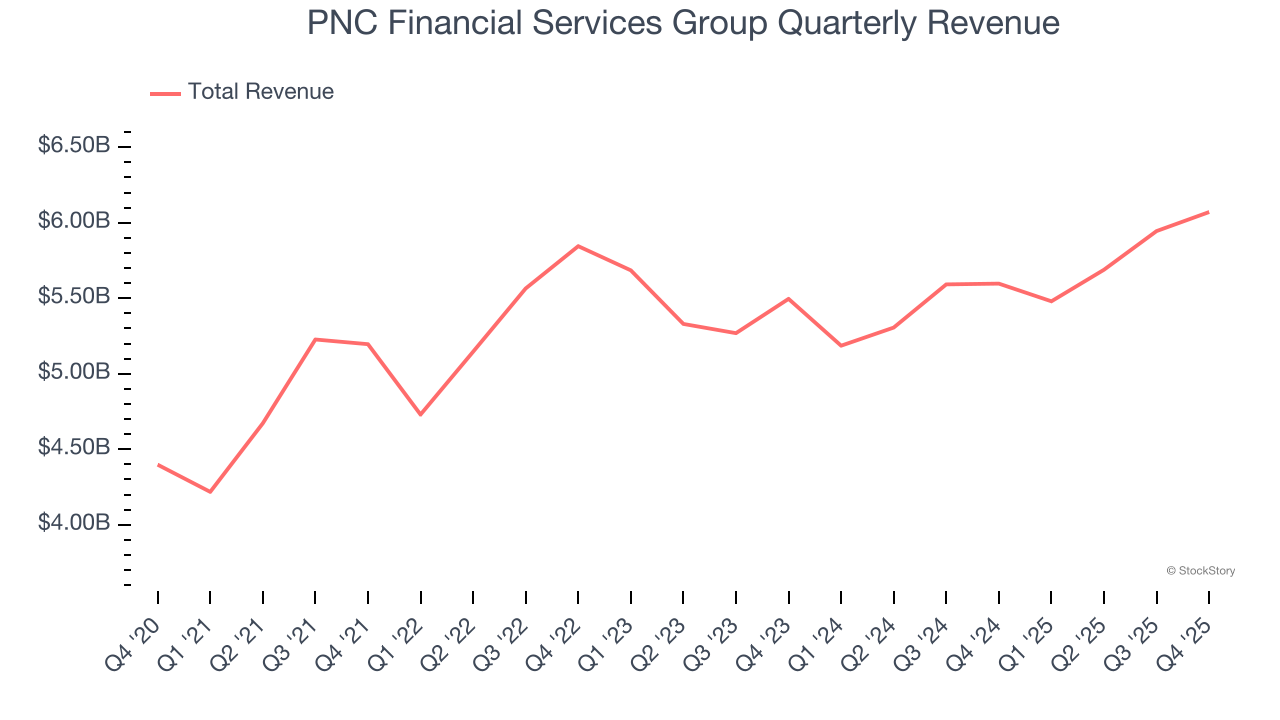
We at StockStory place the most emphasis on long-term growth, but within financials, a half-decade historical view may miss recent interest rate changes, market returns, and industry trends. PNC Financial Services Group’s recent performance shows its demand has slowed as its annualized revenue growth of 3.2% over the last two years was below its five-year trend. 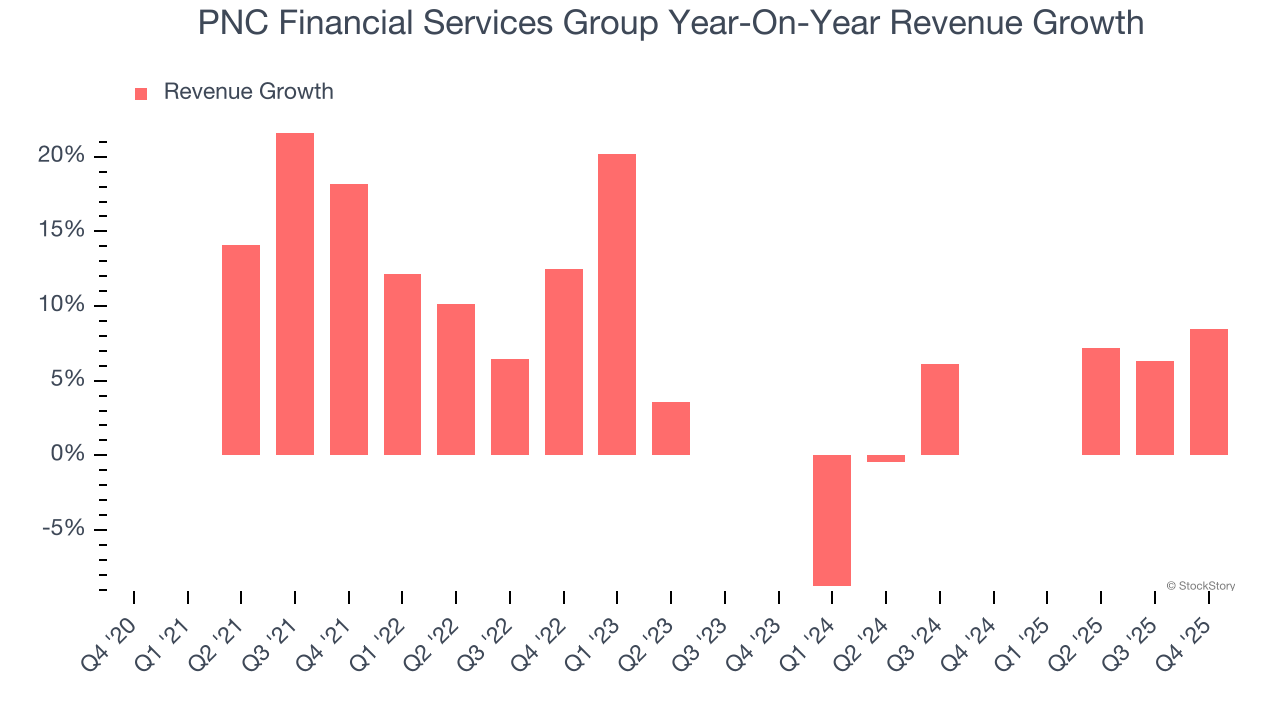 Note: Quarters not shown were determined to be outliers, impacted by outsized investment gains/losses that are not indicative of the recurring fundamentals of the business.
This quarter, PNC Financial Services Group reported year-on-year revenue growth of 8.5%, and its $6.07 billion of revenue exceeded Wall Street’s estimates by 1.7%.
Net interest income made up 60.9% of the company’s total revenue during the last five years, meaning lending operations are PNC Financial Services Group’s largest source of revenue.
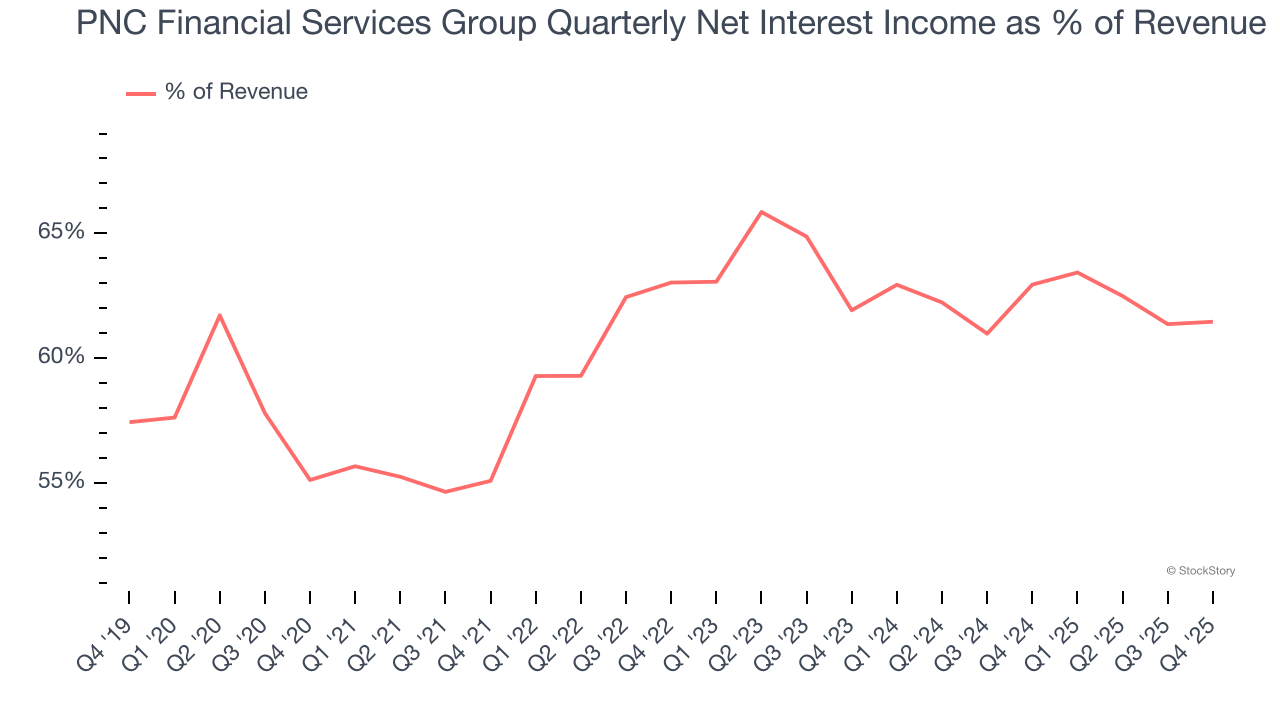
Our experience and research show the market cares primarily about a bank’s net interest income growth as non-interest income is considered a lower-quality and non-recurring revenue source.
Software is eating the world and there is virtually no industry left that has been untouched by it. That drives increasing demand for tools helping software developers do their jobs, whether it be monitoring critical cloud infrastructure, integrating audio and video functionality, or ensuring smooth content streaming. Click here to access a free report on our 3 favorite stocks to play this generational megatrend.
Tangible Book Value Per Share (TBVPS)
The balance sheet drives banking profitability since earnings flow from the spread between borrowing and lending rates. As such, valuations for these companies concentrate on capital strength and sustainable equity accumulation potential.
This explains why tangible book value per share (TBVPS) stands as the premier banking metric. TBVPS strips away questionable intangible assets, revealing concrete per-share net worth that investors can trust. Other (and more commonly known) per-share metrics like EPS can sometimes be murky due to M&A or accounting rules allowing for loan losses to be spread out.
PNC Financial Services Group’s TBVPS grew at a sluggish 2.9% annual clip over the last five years. However, TBVPS growth has accelerated recently, growing by 14.9% annually over the last two years from $85.26 to $112.51 per share.
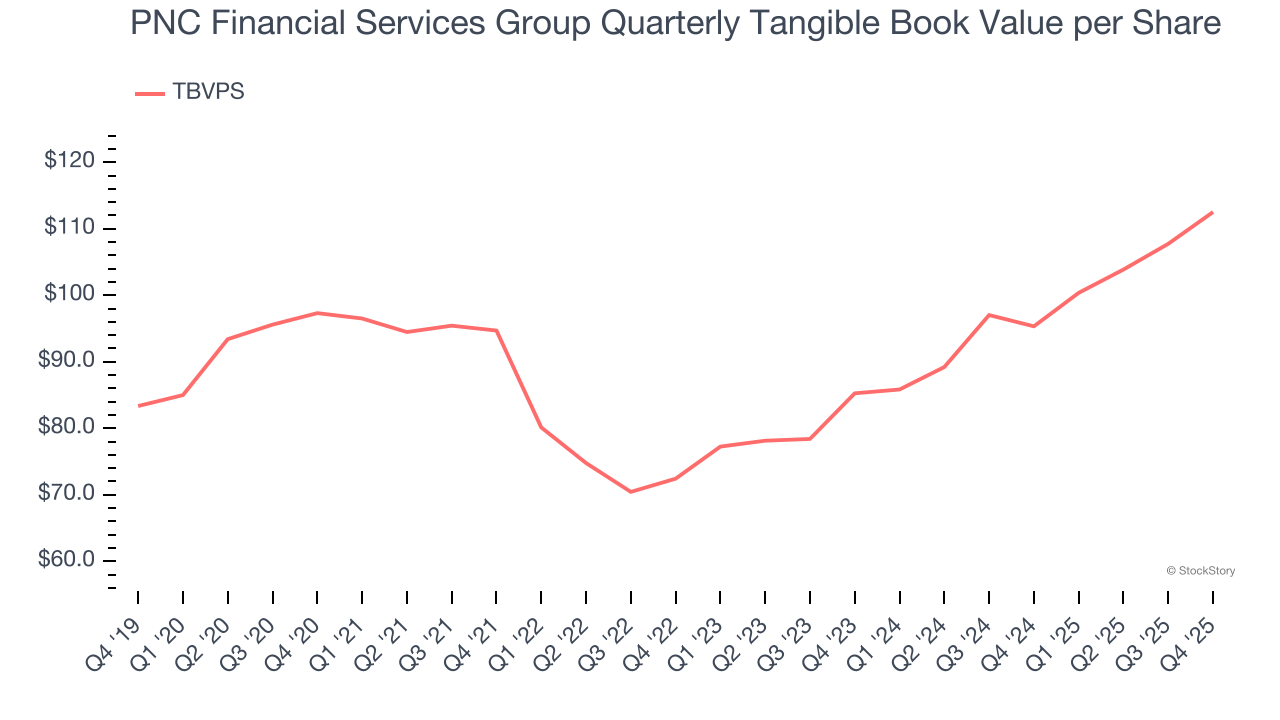
Over the next 12 months, Consensus estimates call for PNC Financial Services Group’s TBVPS to grow by 4.6% to $117.68, lousy growth rate.
Key Takeaways from PNC Financial Services Group’s Q4 Results
It was good to see PNC Financial Services Group beat analysts’ EPS expectations this quarter. We were also happy its tangible book value per share outperformed Wall Street’s estimates. Overall, we think this was a solid quarter with some key areas of upside. The stock traded up 2.8% to $221 immediately after reporting.
PNC Financial Services Group may have had a good quarter, but does that mean you should invest right now? What happened in the latest quarter matters, but not as much as longer-term business quality and valuation, when deciding whether to invest in this stock. We cover that in our actionable full research report which you can read here (it’s free).