Scientific instrument company Bruker (NASDAQ: BRKR). missed Wall Street’s revenue expectations in Q2 CY2025, with sales flat year on year at $797.4 million. The company’s full-year revenue guidance of $3.47 billion at the midpoint came in 1.5% below analysts’ estimates. Its non-GAAP profit of $0.32 per share was 23.4% below analysts’ consensus estimates.
Is now the time to buy Bruker? Find out by accessing our full research report, it’s free.
Bruker (BRKR) Q2 CY2025 Highlights:
- Revenue: $797.4 million vs analyst estimates of $809.2 million (flat year on year, 1.5% miss)
- Adjusted EPS: $0.32 vs analyst expectations of $0.42 (23.4% miss)
- Adjusted EBITDA: $68 million vs analyst estimates of $123.6 million (8.5% margin, 45% miss)
- The company dropped its revenue guidance for the full year to $3.47 billion at the midpoint from $3.52 billion, a 1.4% decrease
- Management lowered its full-year Adjusted EPS guidance to $2 at the midpoint, a 18% decrease
- Operating Margin: 1.5%, down from 6% in the same quarter last year
- Free Cash Flow was -$148.8 million compared to -$25.1 million in the same quarter last year
- Organic Revenue fell 7% year on year (7.4% in the same quarter last year)
- Market Capitalization: $5.76 billion
Company Overview
With roots dating back to the pioneering days of nuclear magnetic resonance technology, Bruker (NASDAQ: BRKR) develops and manufactures high-performance scientific instruments that enable researchers and industrial analysts to explore materials at microscopic, molecular, and cellular levels.
Revenue Growth
A company’s long-term performance is an indicator of its overall quality. Any business can put up a good quarter or two, but many enduring ones grow for years. Thankfully, Bruker’s 11.8% annualized revenue growth over the last five years was decent. Its growth was slightly above the average healthcare company and shows its offerings resonate with customers.
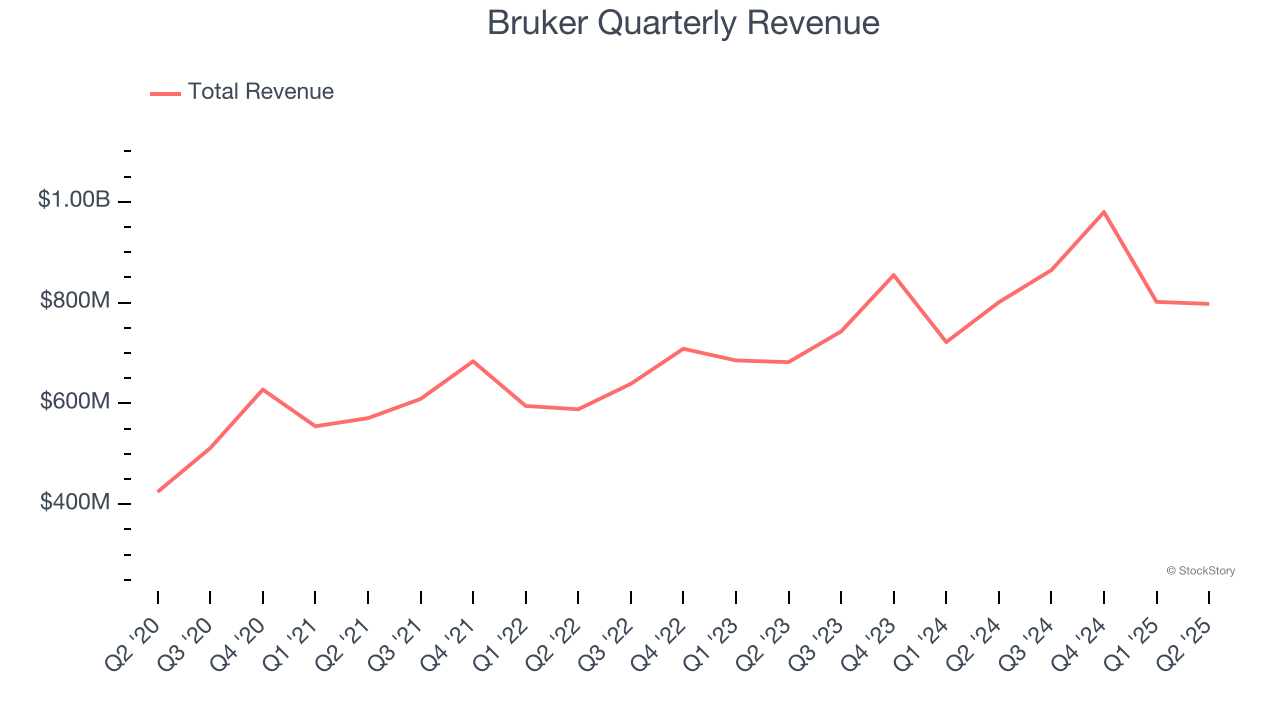
We at StockStory place the most emphasis on long-term growth, but within healthcare, a half-decade historical view may miss recent innovations or disruptive industry trends. Bruker’s annualized revenue growth of 12.6% over the last two years aligns with its five-year trend, suggesting its demand was stable. 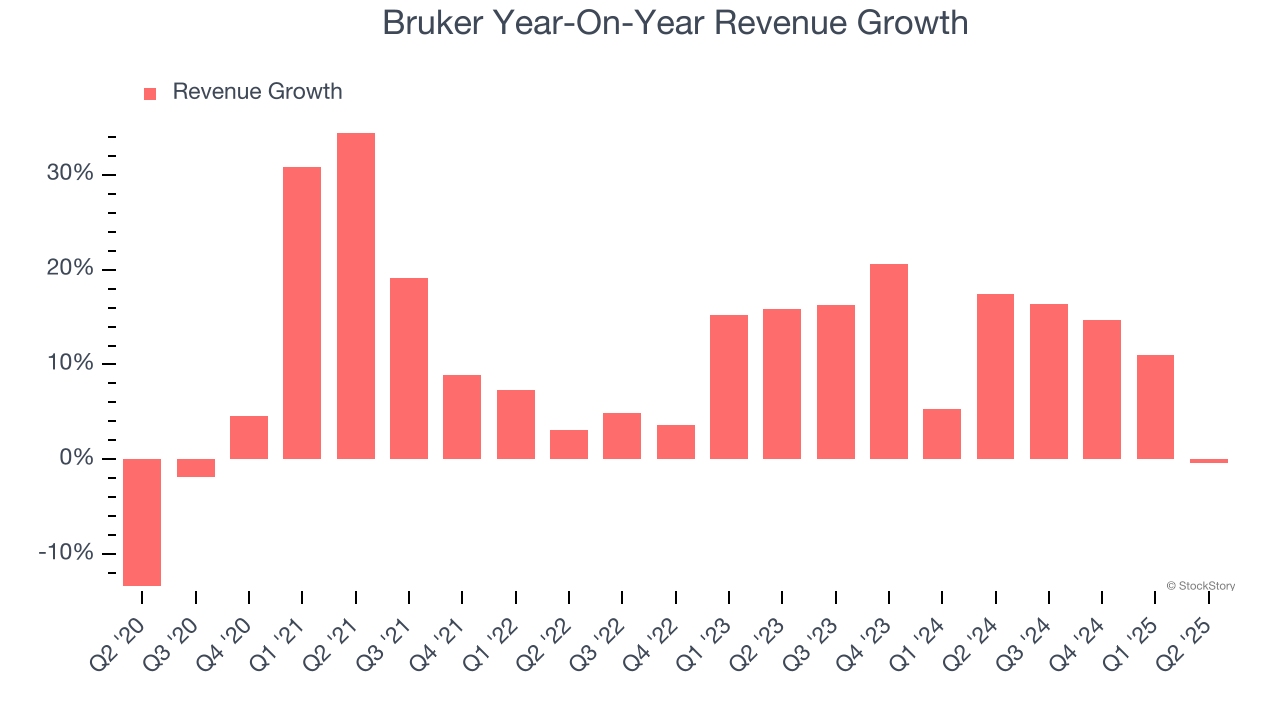
We can better understand the company’s sales dynamics by analyzing its organic revenue, which strips out one-time events like acquisitions and currency fluctuations that don’t accurately reflect its fundamentals. Over the last two years, Bruker’s organic revenue averaged 4.8% year-on-year growth. Because this number is lower than its two-year revenue growth, we can see that some mixture of acquisitions and foreign exchange rates boosted its headline results. 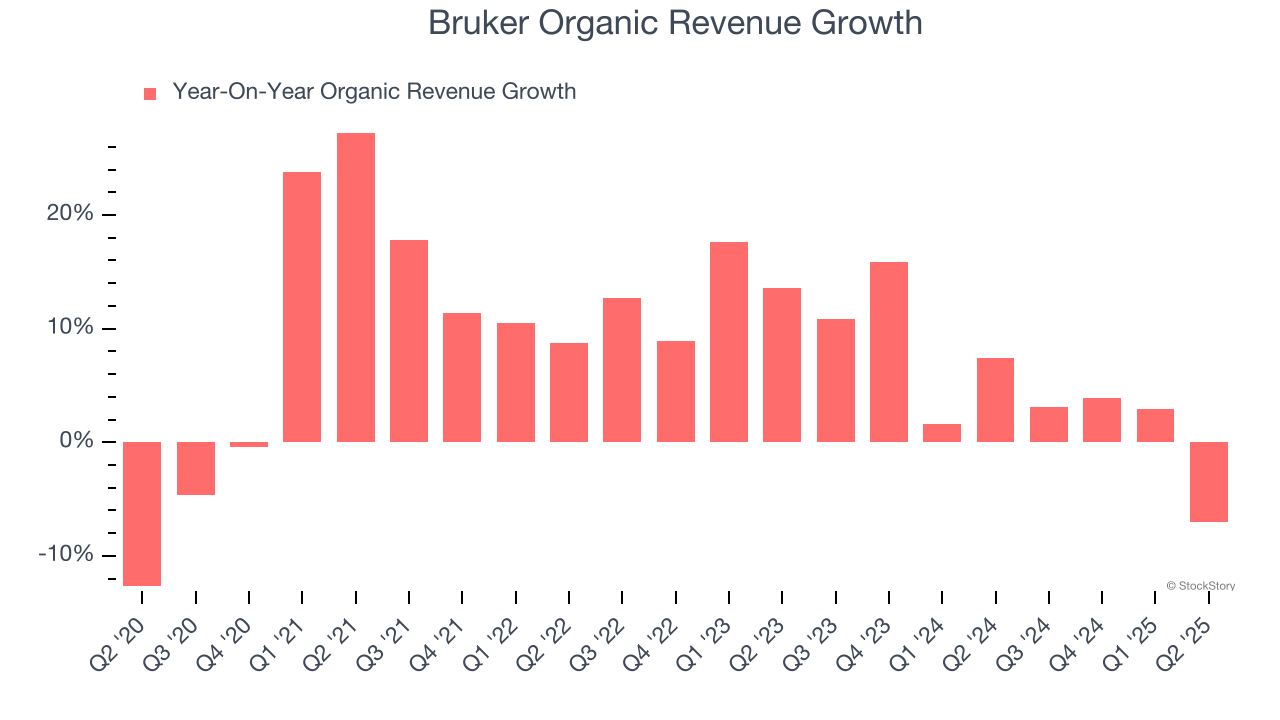
This quarter, Bruker missed Wall Street’s estimates and reported a rather uninspiring 0.4% year-on-year revenue decline, generating $797.4 million of revenue.
Looking ahead, sell-side analysts expect revenue to grow 3.2% over the next 12 months, a deceleration versus the last two years. This projection is underwhelming and suggests its products and services will face some demand challenges.
Software is eating the world and there is virtually no industry left that has been untouched by it. That drives increasing demand for tools helping software developers do their jobs, whether it be monitoring critical cloud infrastructure, integrating audio and video functionality, or ensuring smooth content streaming. Click here to access a free report on our 3 favorite stocks to play this generational megatrend.
Operating Margin
Bruker has done a decent job managing its cost base over the last five years. The company has produced an average operating margin of 12.7%, higher than the broader healthcare sector.
Analyzing the trend in its profitability, Bruker’s operating margin decreased by 10.9 percentage points over the last five years. This performance was caused by more recent speed bumps as the company’s margin fell by 12 percentage points on a two-year basis. We’re disappointed in these results because it shows its expenses were rising and it couldn’t pass those costs onto its customers.
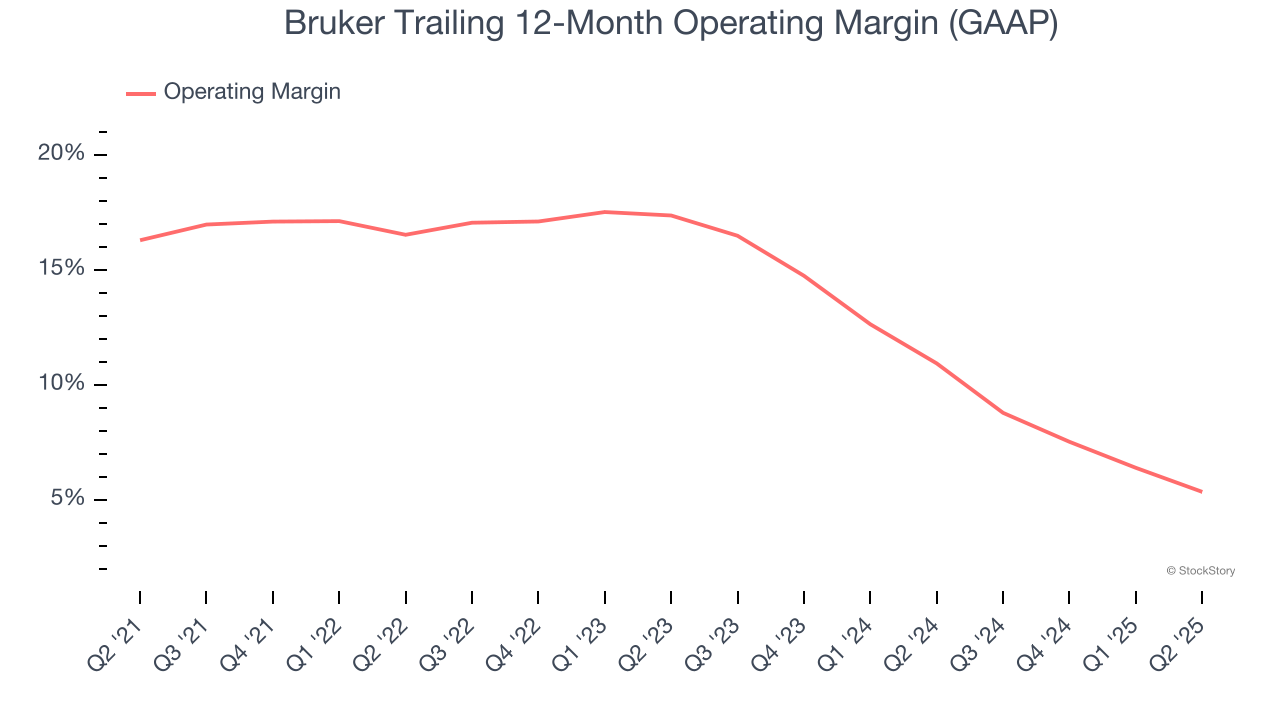
This quarter, Bruker generated an operating margin profit margin of 1.5%, down 4.5 percentage points year on year. This contraction shows it was less efficient because its expenses increased relative to its revenue.
Earnings Per Share
We track the long-term change in earnings per share (EPS) for the same reason as long-term revenue growth. Compared to revenue, however, EPS highlights whether a company’s growth is profitable.
Bruker’s remarkable 10.4% annual EPS growth over the last five years aligns with its revenue performance. This tells us it maintained its per-share profitability as it expanded.
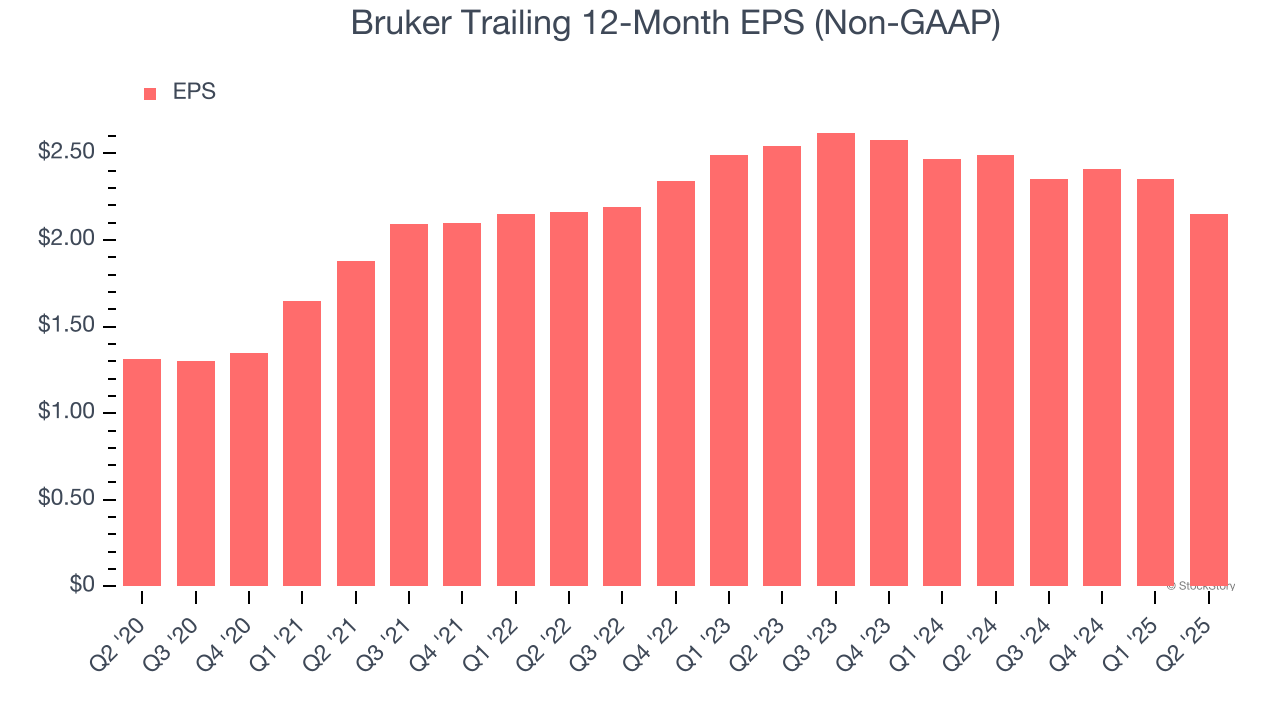
In Q2, Bruker reported adjusted EPS at $0.32, down from $0.52 in the same quarter last year. This print missed analysts’ estimates, but we care more about long-term adjusted EPS growth than short-term movements. Over the next 12 months, Wall Street expects Bruker’s full-year EPS of $2.15 to grow 23%.
Key Takeaways from Bruker’s Q2 Results
We struggled to find many positives in these results. Its full-year EPS guidance missed and its EPS fell short of Wall Street’s estimates. Overall, this was a weaker quarter. The stock traded down 3.9% to $36.48 immediately following the results.
The latest quarter from Bruker’s wasn’t that good. One earnings report doesn’t define a company’s quality, though, so let’s explore whether the stock is a buy at the current price. We think that the latest quarter is only one piece of the longer-term business quality puzzle. Quality, when combined with valuation, can help determine if the stock is a buy. We cover that in our actionable full research report which you can read here, it’s free.