
Maintenance and repair supplier W.W. Grainger (NYSE: GWW) met Wall Street’s revenue expectations in Q3 CY2024, with sales up 4.3% year on year to $4.39 billion. The company’s outlook for the full year was also close to analysts’ estimates with revenue guided to $17.2 billion at the midpoint. Its GAAP profit of $9.87 per share wasalso in line with analysts’ consensus estimates.
Is now the time to buy W.W. Grainger? Find out by accessing our full research report, it’s free.
W.W. Grainger (GWW) Q3 CY2024 Highlights:
- Revenue: $4.39 billion vs analyst estimates of $4.40 billion (in line)
- EPS (GAAP): $9.87 vs analyst expectations of $9.96 (in line)
- EBITDA: $745 million vs analyst estimates of $740.6 million (small beat)
- The company slightly lifted its revenue guidance for the full year to $17.2 billion at the midpoint from $17.15 billion
- EPS (GAAP) guidance for the full year is $39 at the midpoint, beating analyst estimates by 1.1%
- Gross Margin (GAAP): 39.2%, in line with the same quarter last year
- Operating Margin: 15.6%, in line with the same quarter last year
- EBITDA Margin: 17%, in line with the same quarter last year
- Free Cash Flow Margin: 11.9%, up from 9.5% in the same quarter last year
- Organic Revenue rose 4% year on year (8.7% in the same quarter last year)
- Market Capitalization: $53.68 billion
"From helping customers respond to natural disasters to supporting their safety needs, the team remains sharply focused on providing a flawless experience. As a result, throughout the third quarter, our customer relationships grew and results remained solid amidst a slow, but steady demand market, " said D.G. Macpherson, Chairman and CEO.
Company Overview
Founded as a supplier of motors, W.W. Grainger (NYSE: GWW) provides maintenance, repair, and operating (MRO) supplies and services to businesses and institutions.
Maintenance and Repair Distributors
Supply chain and inventory management are themes that grew in focus after COVID wreaked havoc on the global movement of raw materials and components. Maintenance and repair distributors that boast reliable selection and quickly deliver products to customers can benefit from this theme. While e-commerce hasn’t disrupted industrial distribution as much as consumer retail, it is still a real threat, forcing investment in omnichannel capabilities to serve customers everywhere. Additionally, maintenance and repair distributors are at the whim of economic cycles that impact the capital spending and construction projects that can juice demand.
Sales Growth
Reviewing a company’s long-term performance can reveal insights into its business quality. Any business can have short-term success, but a top-tier one sustains growth for years. Thankfully, W.W. Grainger’s 8.2% annualized revenue growth over the last five years was decent. This is a useful starting point for our analysis.
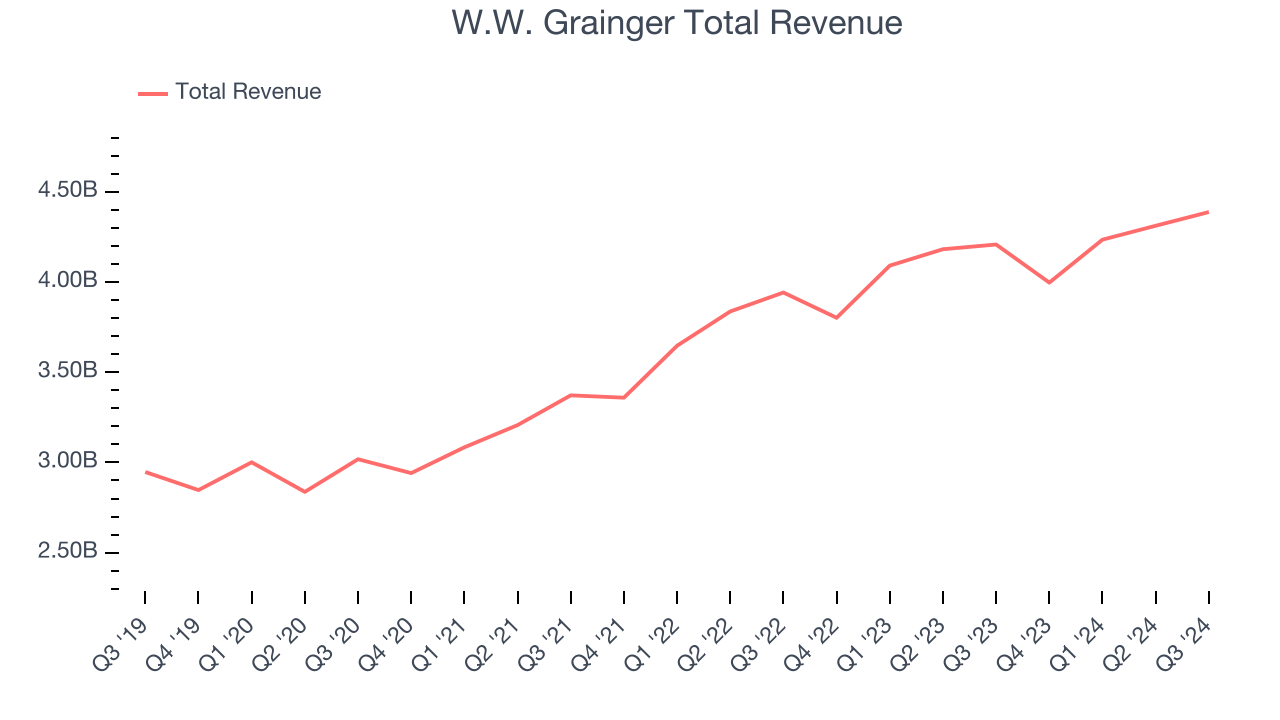
Long-term growth is the most important, but within industrials, a half-decade historical view may miss new industry trends or demand cycles. W.W. Grainger’s recent history shows its demand slowed as its annualized revenue growth of 7% over the last two years is below its five-year trend. 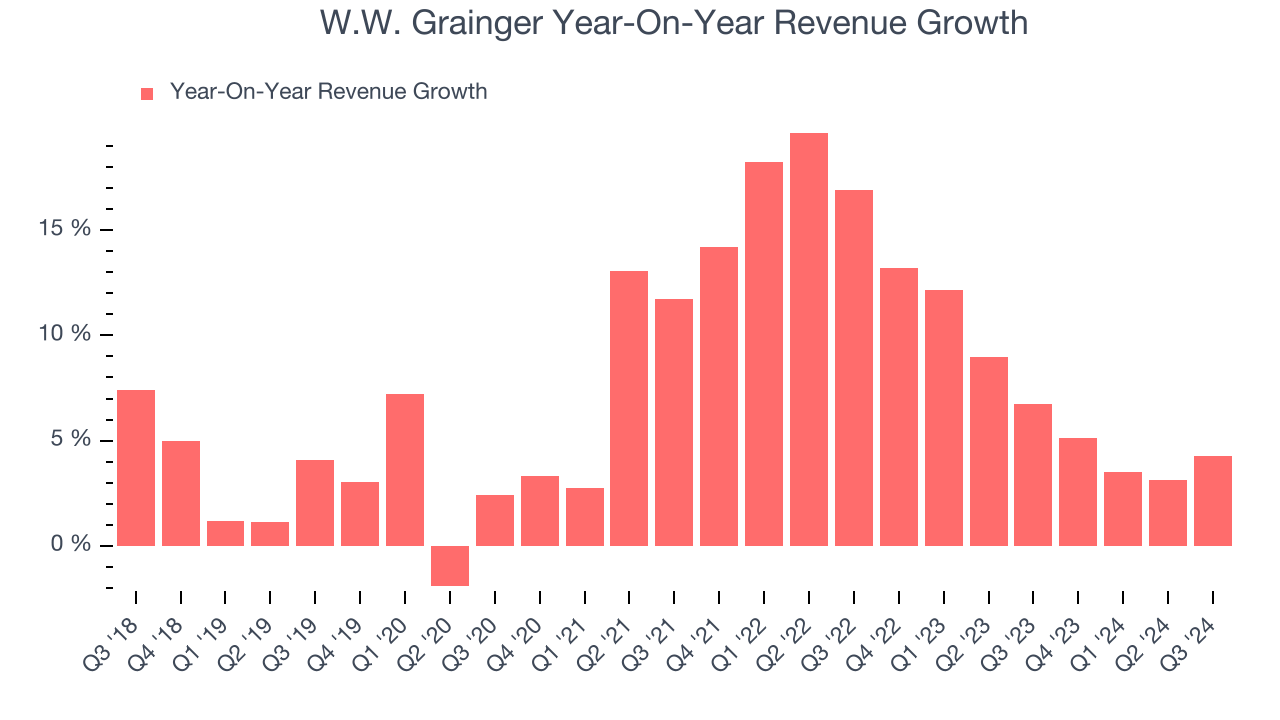
We can better understand the company’s sales dynamics by analyzing its organic revenue, which strips out one-time events like acquisitions and currency fluctuations because they don’t accurately reflect its fundamentals. Over the last two years, W.W. Grainger’s organic revenue averaged 8.8% year-on-year growth. Because this number is better than its normal revenue growth, we can see that some mixture of divestitures and foreign exchange rates dampened its headline performance. 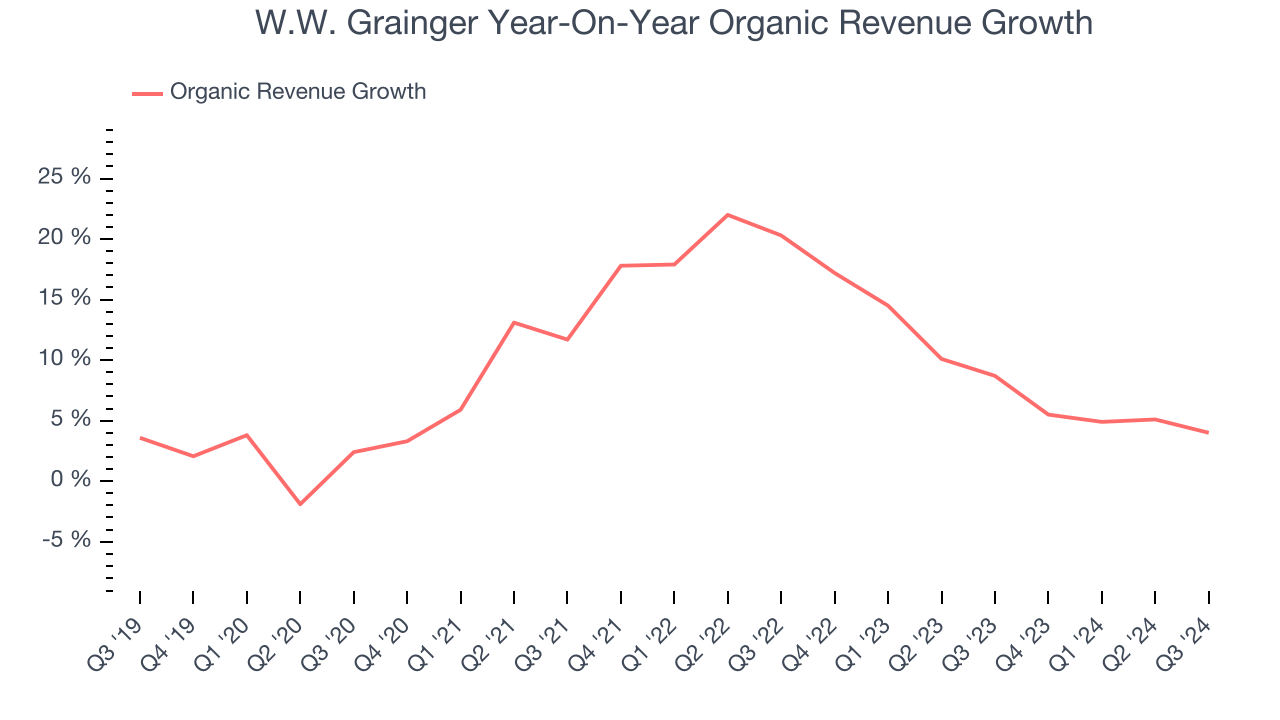
This quarter, W.W. Grainger grew its revenue by 4.3% year on year, and its $4.39 billion of revenue was in line with Wall Street’s estimates.
Looking ahead, sell-side analysts expect revenue to grow 6% over the next 12 months, a slight deceleration versus the last two years. This projection doesn't excite us and shows the market thinks its products and services will face some demand challenges. At least the company is tracking well in other measures of financial health.
When a company has more cash than it knows what to do with, buying back its own shares can make a lot of sense–as long as the price is right. Luckily, we’ve found one, a low-priced stock that is gushing free cash flow AND buying back shares. Click here to claim your Special Free Report on a fallen angel growth story that is already recovering from a setback.
Operating Margin
W.W. Grainger has been an optimally-run company over the last five years. It was one of the more profitable businesses in the industrials sector, boasting an average operating margin of 13.2%. This result isn’t surprising as its high gross margin gives it a favorable starting point.
Looking at the trend in its profitability, W.W. Grainger’s annual operating margin rose by 7.2 percentage points over the last five years, showing its efficiency has meaningfully improved.
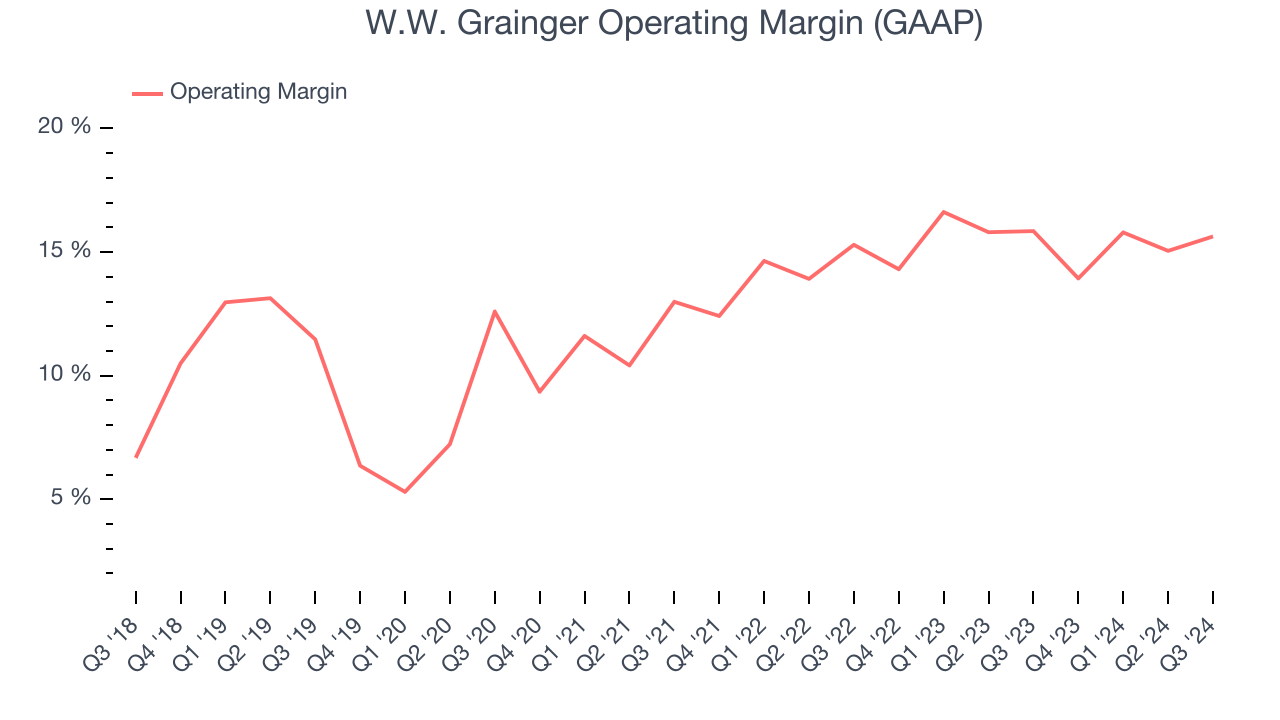
In Q3, W.W. Grainger generated an operating profit margin of 15.6%, in line with the same quarter last year. This indicates the company’s cost structure has recently been stable.
Earnings Per Share
We track the long-term change in earnings per share (EPS) for the same reason as long-term revenue growth. Compared to revenue, however, EPS highlights whether a company’s growth was profitable.
W.W. Grainger’s EPS grew at a spectacular 16.7% compounded annual growth rate over the last five years, higher than its 8.2% annualized revenue growth. This tells us the company became more profitable as it expanded.
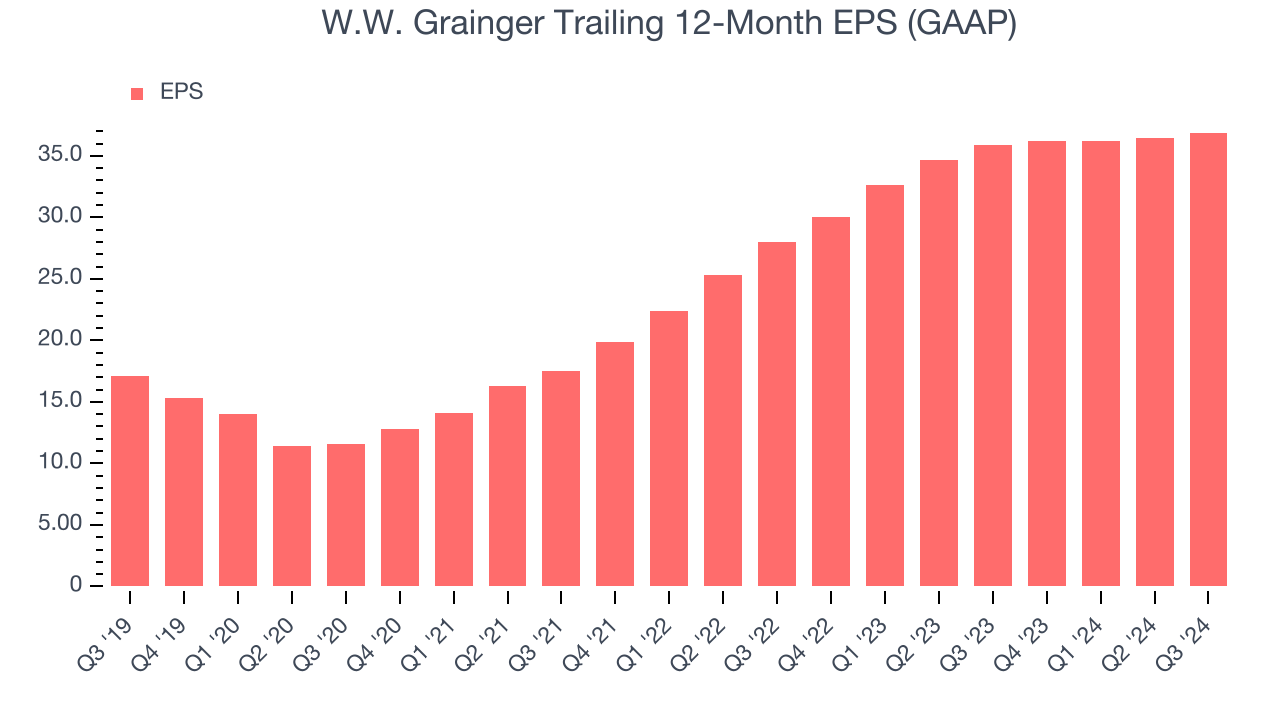
We can take a deeper look into W.W. Grainger’s earnings to better understand the drivers of its performance. As we mentioned earlier, W.W. Grainger’s operating margin was flat this quarter but expanded by 7.2 percentage points over the last five years. On top of that, its share count shrank by 10.1%. These are positive signs for shareholders because improving profitability and share buybacks turbocharge EPS growth relative to revenue growth. 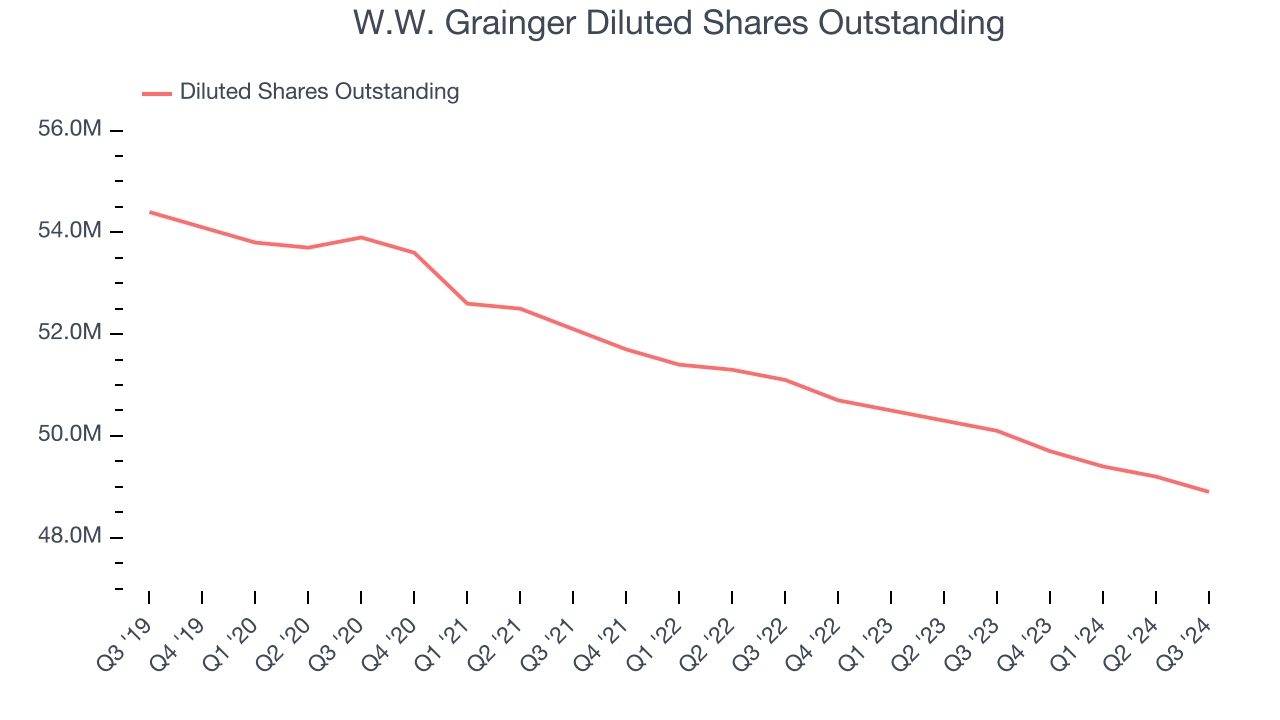
Like with revenue, we analyze EPS over a shorter period to see if we are missing a change in the business.
For W.W. Grainger, its two-year annual EPS growth of 14.8% was lower than its five-year trend. We still think its growth was good and hope it can accelerate in the future.In Q3, W.W. Grainger reported EPS at $9.87, up from $9.43 in the same quarter last year. This print was close to analysts’ estimates. Over the next 12 months, Wall Street expects W.W. Grainger’s full-year EPS of $36.89 to grow by 11.8%.
Key Takeaways from W.W. Grainger’s Q3 Results
We enjoyed seeing W.W. Grainger beat analysts’ full-year EPS guidance expectations. On the other hand, its organic revenue missed and its EPS fell short of Wall Street’s estimates. Overall, this quarter could have been better. The stock traded down 1.9% to $1,080 immediately after reporting.
Is W.W. Grainger an attractive investment opportunity right now? The latest quarter does matter, but not nearly as much as longer-term fundamentals and valuation, when deciding if the stock is a buy. We cover that in our actionable full research report which you can read here, it’s free.


