As the first quarter of 2026 draws to a close, the U.S. stock market is grappling with a significant technical identity crisis. After the S&P 500 (INDEXSP:.INX) reached a historic psychological milestone of 7,002 in late January, the index has spent the last eight weeks in a controlled but persistent retreat. As of today, March 24, 2026, the market is testing the nerves of investors as it hovers precariously near its 200-day moving average, a level that has served as the definitive "line in the sand" for the bull market that began in late 2024.
The current correction has shaved nearly 7% off the index's January peak, yet the broader context remains one of historical strength. Despite the recent volatility, the S&P 500 maintains a 13.5% year-over-year gain, a testament to the massive AI-driven rally that dominated 2025. However, with geopolitical tensions in the Middle East driving energy prices higher and the Federal Reserve adopting a "hawkish hold" stance, analysts are divided on whether this pullback is a healthy consolidation or the beginning of a deeper technical breakdown.
The Technical Retreat: From 7,000 to the "Line in the Sand"
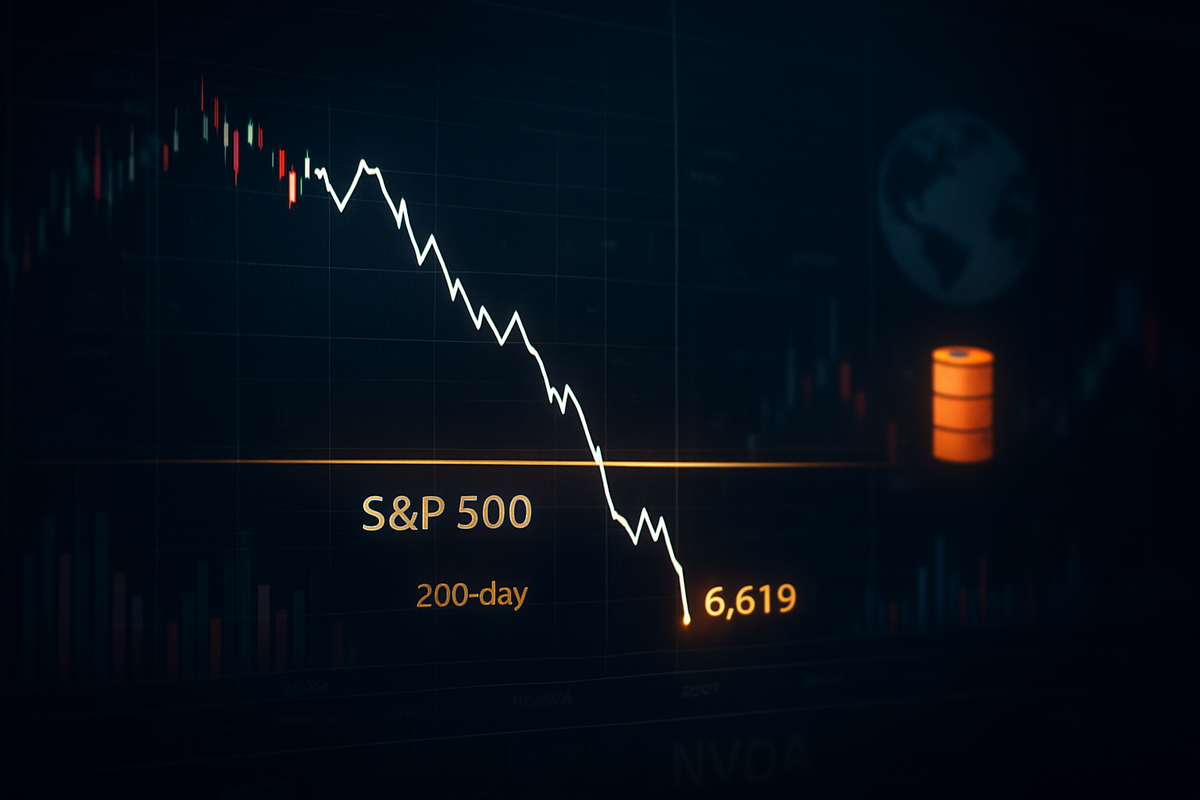
The decline from the 7,002 peak has been characterized by a "rounded top" formation, a technical pattern that often signals institutional distribution. The selling intensified in late February following the outbreak of the Iran conflict, which sent Brent Crude prices past the $100 mark. This exogenous shock transformed a standard cooling-off period into a rigorous test of the market's structural support. Currently, the index is oscillating between its immediate support at 6,538—the March low—and the critical 200-day Simple Moving Average (SMA) at 6,619.
Technicians are watching the 6,619 level with extreme focus. A sustained close below this average would represent the first time the S&P 500 has traded under its 200-day trend line since May 2025. If this floor gives way, analysts at JPMorgan (NYSE: JPM) and other major institutions warn of a potential "waterfall" decline toward the 6,144 level. This secondary support zone represents a 10% technical correction from the January highs and aligns with the major breakout level seen in June 2025.
The market’s internal health is also under scrutiny as it approaches the end of the quarter. While the 13.5% year-over-year gain suggests long-term resilience, the recent "lower highs" on the daily charts indicate that the momentum which carried the index through the 6,000s has stalled. Most analysts expect the remainder of March to be a period of high-frequency "churn," as fund managers rebalance portfolios and prepare for a Q1 earnings season that will need to justify the still-lofty valuations of the major technology constituents.
A Fractured Tech Landscape: Winners and Losers in the Correction
The divergence within the "Magnificent Seven" has become the defining story of this correction. NVIDIA (NASDAQ: NVDA), the undisputed leader of the AI era, has managed to maintain a relative floor in the $175–$190 range despite the broader market sell-off. CEO Jensen Huang’s recent unveiling of the "Vera Rubin" platform and a reported $1 trillion backlog have provided enough fundamental support to prevent a total collapse, though the stock has struggled to reclaim its January highs as "peak AI" concerns begin to percolate.
In contrast, Microsoft (NASDAQ: MSFT) has emerged as a significant weight on the index, down nearly 20% year-to-date. A massive reorganization of its Copilot division in mid-March, aimed at addressing a disappointing 3.3% penetration rate among its enterprise users, has rattled investor confidence. For the first time in three years, the market is questioning the immediate ROI of Microsoft’s massive capital expenditures, leading to a rotation out of the software giant and into more defensive sectors.
Meanwhile, Apple (NASDAQ: AAPL) has shown surprising grit, down only 7% in March despite significant supply chain headwinds and rising DRAM costs. The company's ability to capture market share in a contracting Chinese smartphone market has provided a "flight to quality" destination for investors wary of the more volatile AI plays. On the losing side of this rotation, high-growth cloud and SaaS companies are seeing their multiples compressed as the "higher-for-longer" interest rate narrative returns to the forefront of the macroeconomic conversation.
Global Turmoil and the Return of Stagflation Fears
The wider significance of the current market levels cannot be understood without the context of the "Oil Shock of 2026." The closure of the Strait of Hormuz in February has spiked Brent Crude to $120 a barrel, injecting a fresh dose of inflation into a global economy that many thought had moved past the price-stability crisis of the early 2020s. This has forced the Federal Reserve to pause its planned cycle of interest rate cuts, holding the Federal Funds Rate at 3.50%–3.75%.
This shift in Fed policy has historical echoes of the 1970s, raising fears of "stagflation"—a period of stagnant growth coupled with persistent inflation. With U.S. GDP growth for the previous quarter coming in at a modest 1.4%, the market is now pricing in a much leaner economic environment than the exuberant projections of late 2025 suggested. The 13.5% year-over-year gain is currently acting as a psychological buffer, but as energy costs eat into consumer spending, that buffer is thinning.
Furthermore, the regulatory environment is beginning to shift. As the AI sector matures, governments in both the U.S. and the EU are ramping up antitrust and data-sovereignty investigations. This added layer of uncertainty is weighing on the premium valuations of the tech sector, which has historically been the primary engine of the S&P 500's growth. The current correction is not just a technical retreat; it is a recalibration of what investors are willing to pay for growth in an era of $100 oil and 3.5% interest rates.
The Path to Q2: Strategic Pivots and Potential Scenarios
As the calendar turns to April, the market faces two primary scenarios. The bullish outcome hinges on the 6,619 support level holding firm through the end of the quarter. If corporate earnings in early April show that the "AI tailwind" is still translating into bottom-line growth—particularly in sectors beyond hardware—the S&P 500 could see a relief rally back toward the 6,800 resistance zone. This would signify a healthy mid-cycle correction rather than a trend reversal.
Conversely, a bearish break below the 200-day SMA would likely trigger a wave of algorithmic selling. In this scenario, the market would likely seek out the 6,144 support level, representing a full 10% retracement. Institutional investors would likely move into more defensive postures, favoring Value stocks and Staples over high-beta Tech. Investors should also watch for any de-escalation in the Middle East, as a "peace dividend" in the form of lower oil prices would be the most immediate catalyst for a market-wide rebound.
The short-term outlook requires a strategic pivot toward quality and cash flow. The days of "rising tides lifting all boats" that defined 2025 appear to be over. Portfolio managers are increasingly looking at energy producers and domestic manufacturers as hedges against the ongoing geopolitical volatility, while maintaining a selective exposure to the AI leaders who can prove actual revenue generation from their multi-billion dollar investments.
Conclusion: Watching the Walls for the Next Move
The S&P 500's journey from the 7,002 summit to the current 6,619 battleground marks a pivotal moment for the 2026 market. While the year-over-year gain of 13.5% is still impressive, it is the speed and nature of the recent decline that has institutional desks on high alert. The combination of an energy shock and a "hawkish hold" from the Federal Reserve has stripped away the margin for error for many of the market’s top-performing stocks.
Moving forward, the primary takeaway for investors is that technical levels are currently outweighing narrative. The 200-day moving average is not just a line on a chart; it is the boundary between a bull market correction and a potential bear market entry. In the coming weeks, the focus will shift squarely to the Q1 earnings reports and the Fed's commentary on persistent energy-driven inflation.
Investors should remain vigilant, watching for a confirmed close below 6,600 as a signal to reduce risk. While the long-term AI thesis remains intact, the "price of admission" for that growth has become significantly more expensive. The next month will determine whether the 7,000 level was a final peak for the cycle or merely a rest stop on the way to even higher ground.
This content is intended for informational purposes only and is not financial advice.