Worldwide vehicle parts supplier and manufacturer Magna International Inc. (NYSE: MGA) is one of the most significant players in the automobile and electric vehicles (EV) space you’ve probably never heard of. It supplies auto parts to over 50 of the world’s largest automobile brands, including General Motors Co. (NYSE: GM), Ford Motor Co. (NYSE: F), and Tesla Inc. (NASDAQ: TSLA) in the US and Volkswagen AG (OTCMKTS: VWAGY) and BMW in Europe. Magna makes everything from powertrains to doors, seats, and transmissions. Its facilities can manufacture over 200,000 vehicles annually, making it the world's largest automobile contractor.
Fisker Trouble?
It’s enabled EV brand Fisker Inc. (NYSE: FSR) to outsource production of its long-awaited Ocean SUV electric vehicle to Magna at its Austria plant. Magna is contracted to produce up to 50,000 Ocean SUVs annually. However, Magna missed EPS expectations in Q4 2022, extinguishing its earlier hopes for a second-half 2022 recovery from inflation, supply chain disruptions, and recessionary fears.
Investors feared the worst and sold down shares of Magna by 15%, and Fisker shares fell by 8%. The Company stated that semiconductors were still facing supply constraints. Inflationary pressures on labor, energy, and materials will continue to compress margins in 2023. It also noted that inefficiencies in European production hurt its performance stemming from continued geopolitical disruptions.
Taking a Look at the Numbers
On Feb. 10, 2022, Magna released its fourth-quarter 2022 results for December 2022. The Company reported an earnings-per-share (EPS) profit of $0.91, excluding non-recurring items, versus consensus analyst estimates for $1.08, a $0.17 miss. Revenues grew 5% year-over-year (YoY) to $9.57 billion, beating analyst estimates of $9.51 billion. The Company raised its quarterly dividend to $0.46 from $0.45, payable on March 10, 2023, to shareholders on record as of Feb. 24, 2023.
Breaking Down the Numbers By Division
Magna saw a 13% growth in organic sales. Body, Exteriors & Structures saw 11% growth to $4 billion. Seating Systems had a 4% bounce to $1.3 billion. Power & Vision saw an 8% increase in sales to $3 billion. Complete Vehicle sales fell 12% to $1.3 billion. This revelation caused Fisker shares to tumble as production of its Ocean EVs started in November 2022.
Flat Guidance
Magna provided in-line revenue guidance for full-year 2023 between $39.6 billion to $41.2 billion versus $39.93 billion. It also targets 2025 revenues between $44.7 billion to $47.2 billion. Adjusted EBIT margin is expected between 6.7% to 7.8%.
Plaguing Issues
IN THE CONFERENCE CALL, Magna CEO Swamy Kotagiri commented, “Although vehicle building recovered from the 2021 levels, OEM production schedules remained volatile throughout 2022, which drove significant inefficiencies in our operations, including tapped labor, overtime, and staffing availability issues, to name a few. It also harmed our ability to achieve our continuous improvement plans and optimize our cost structure across the company.”
He noted they started 2022 expecting $275 million net input cost inflation. They ended the year with $530 million in net input cost inflation. The Ukraine war and China's zero-COVID policy resulting in lockdowns cost Magna $290 million in headwinds. The bright spot is that lifting restrictions in China should help ease some of the supply chain issues.
Two-Year Weekly Falling Price Channel
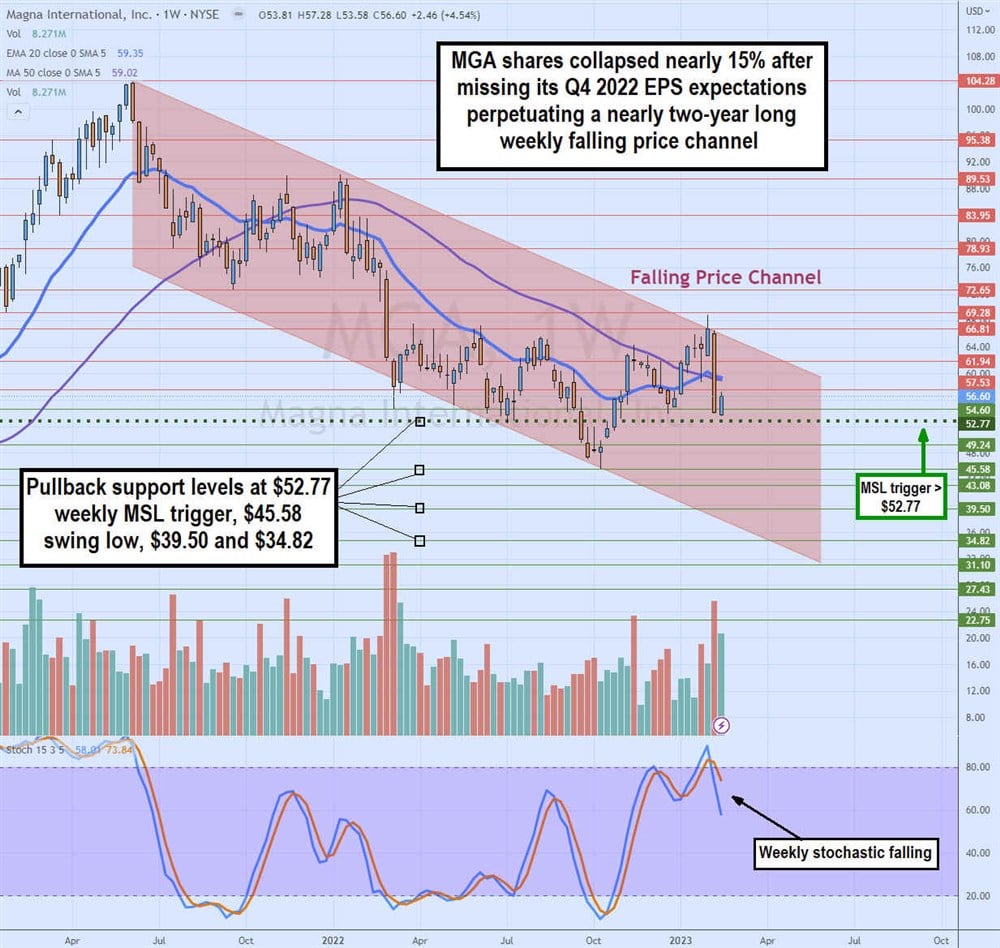
MGA weekly candlestick chart depicts a nearly two-year-long falling price channel that started in June 2021 after peaking at $104.28 and falling to a swing low of 45.58 by October 2022. The weekly stochastic bounce back up through the 20-band and subsequent complete oscillation enabled shares to rebound on the $52.77 market structure low (MSL) trigger.
MGA appeared to be breaking out of the price channel resistance at $66.81 when shares hit $68.92 heading into February 2023.
Unfortunately, its Q4 2022 earnings disappointment pulled shares right back into the falling price channel as it desperately tried to hold the weekly MSL trigger. The weekly 20-period exponential moving average (EMA) resistance overlaps with the weekly 50-period MA around $59.35.
The weekly stochastic is falling again after breaking down through the 80-band. Pullback support levels are at $52.77 weekly MSL trigger, $45.58 swing low, $39.50, and $34.82.