I love the Dow Jones Industrial Average ($DOWI). Not for its weird weighting system, but for the 30 stocks themselves. I think they represent a true blue-chip U.S. stock basket.
I also like my ROAR Score, and appreciate that I’m able to write about it here. My goal is always to introduce Barchart readers to my No. 1 priority when investing and trading: risk management.
So when I find a timely way to combine those two passions, it’s a good day! Even if the news is discouraging for stock market bulls.
I regularly run ROAR Scores on the 30 Dow stocks. I have found it to be a great leading indicator of broader stock market performance.
Where Dow Stocks Have Been
I’ll show you some representative pictures later. For now, let’s do some simple math. Whenever I am finished analyzing ROAR Scores for the 30 Dow stocks, I then add them up and divide by 30. That gives me the average weight of those blue-chip giants.
Not long ago, it was hanging between 40 and 50. For several weeks. That was a signal to me that the market was rangebound, since 40-60 is a neutral risk range.
By no means does a low score mean a stock can’t go up. It simply means it must overcome steep odds to do so. ROAR is entirely a technical analysis (charting) process, essentially an automated chart-reader I built to process large amounts of data quickly. And hopefully, to enable more informed decision making.
Likewise, a high ROAR Score is not a “buy” signal. That type of terminology is not in my investment vocabulary. Because every investor decides for themselves how much risk to take. I’m just trying to put a number on that expected risk level at all times.
In fact, very low ROAR Scores often make the best option collars. Because if the downside is that bad, I’ll want to hedge it. But oh, if the shock value of the “buy the dip” trade strikes? Yowza. Lots of upside from that depressed stock price level. Alternatively, I might take a very small position in a stock with a low ROAR Score, since I’m willing to lose a high percentage of a small amount of dollars. The whole key to risk management is to avoid losing a high percentage on a BIG amount of dollars!
What Does This Dow Indicator Say Now? Look Out Below.
The scores of the 30 Dow stocks add up to a total of 740. Divide that by 30 names and we get an average ROAR Score of about 25. That’s firmly in the high-risk range. But wait, there’s more.
A score on its own is just one data point. Scores of 30 stocks (these or others) are a better sample size. Compare those 30 to where they were at a recent past point in time? Now, we have a trend to observe.
60 trading days ago, the average Dow stock had a ROAR Score of 46. 20 days ago, it slipped, but only to 44.
The takeaway: Dow stock risk, and by association, market risk, has risen sharply, as evidenced by the average ROAR Score being cut in half.
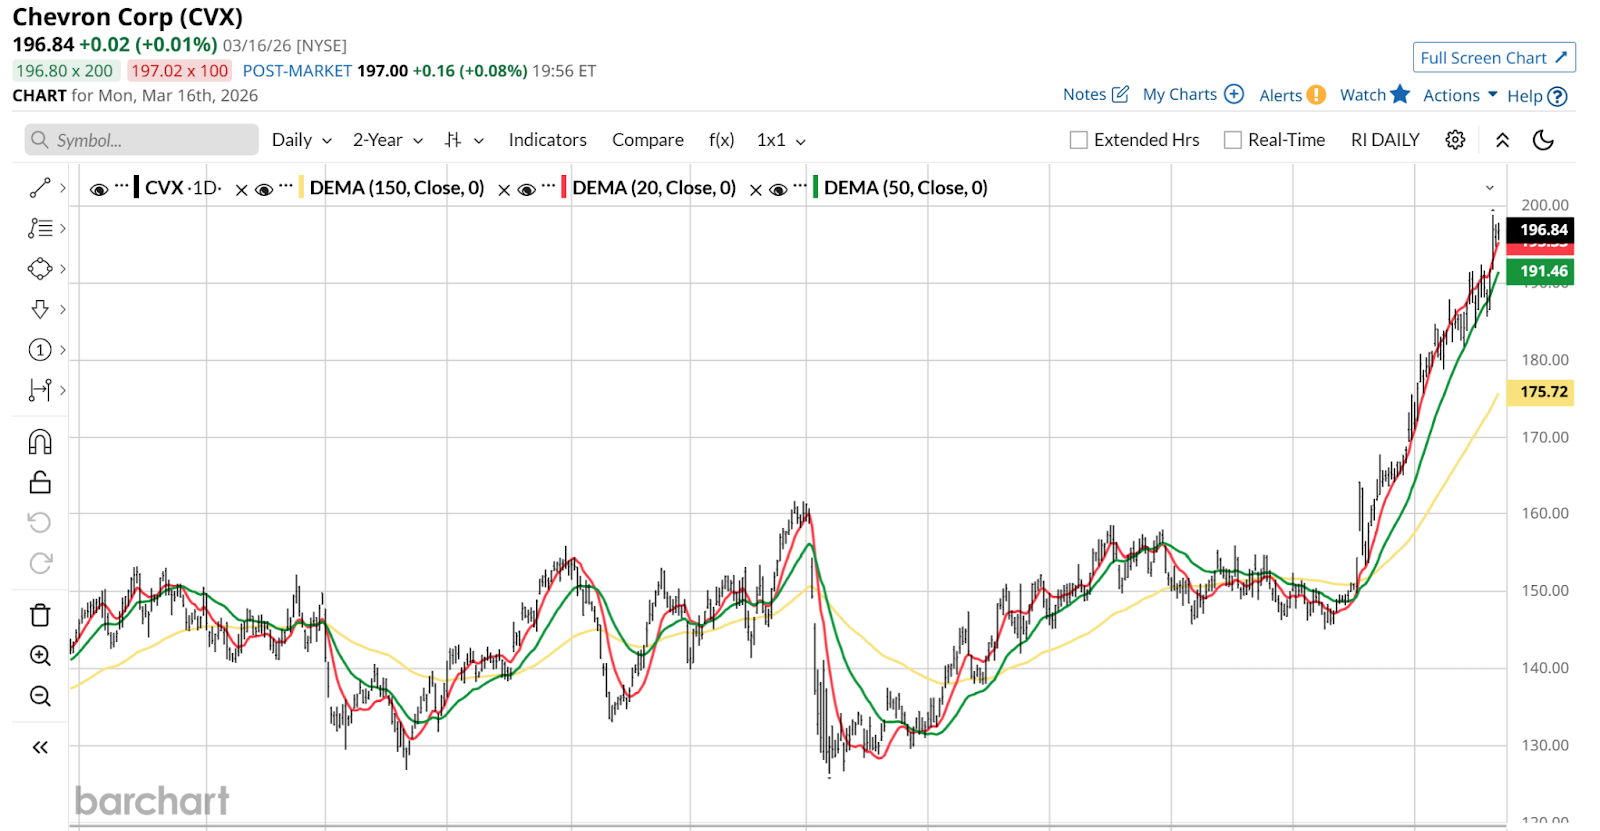
As I see it, that does not change the market’s upside potential at all. Any stock can go up in price at any time, for any reason. Take energy stocks. Chevron (CVX) is the only one in the Dow, so let’s look at it. Its ROAR Score is currently at 50, and it has been in at least neutral territory for at least 2 months.
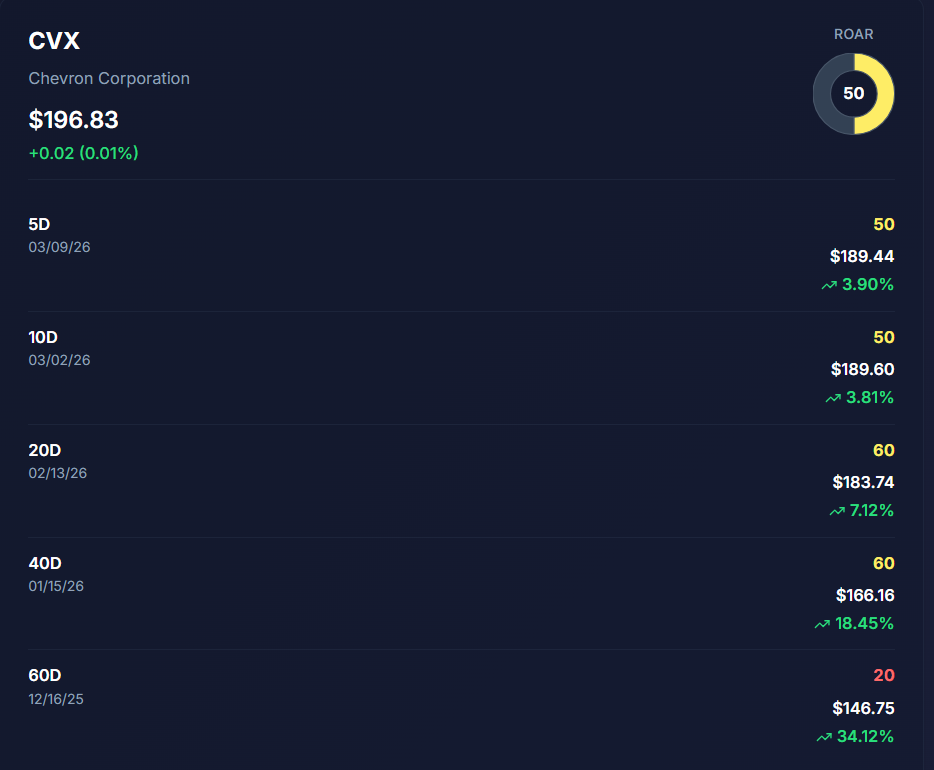
However, the move shown below was due to an oil price shock from a war breaking out. ROAR correctly assessed that risk was not high. But CVX was not exactly “on sale” either. That’s a good example of what I aim to communicate here.
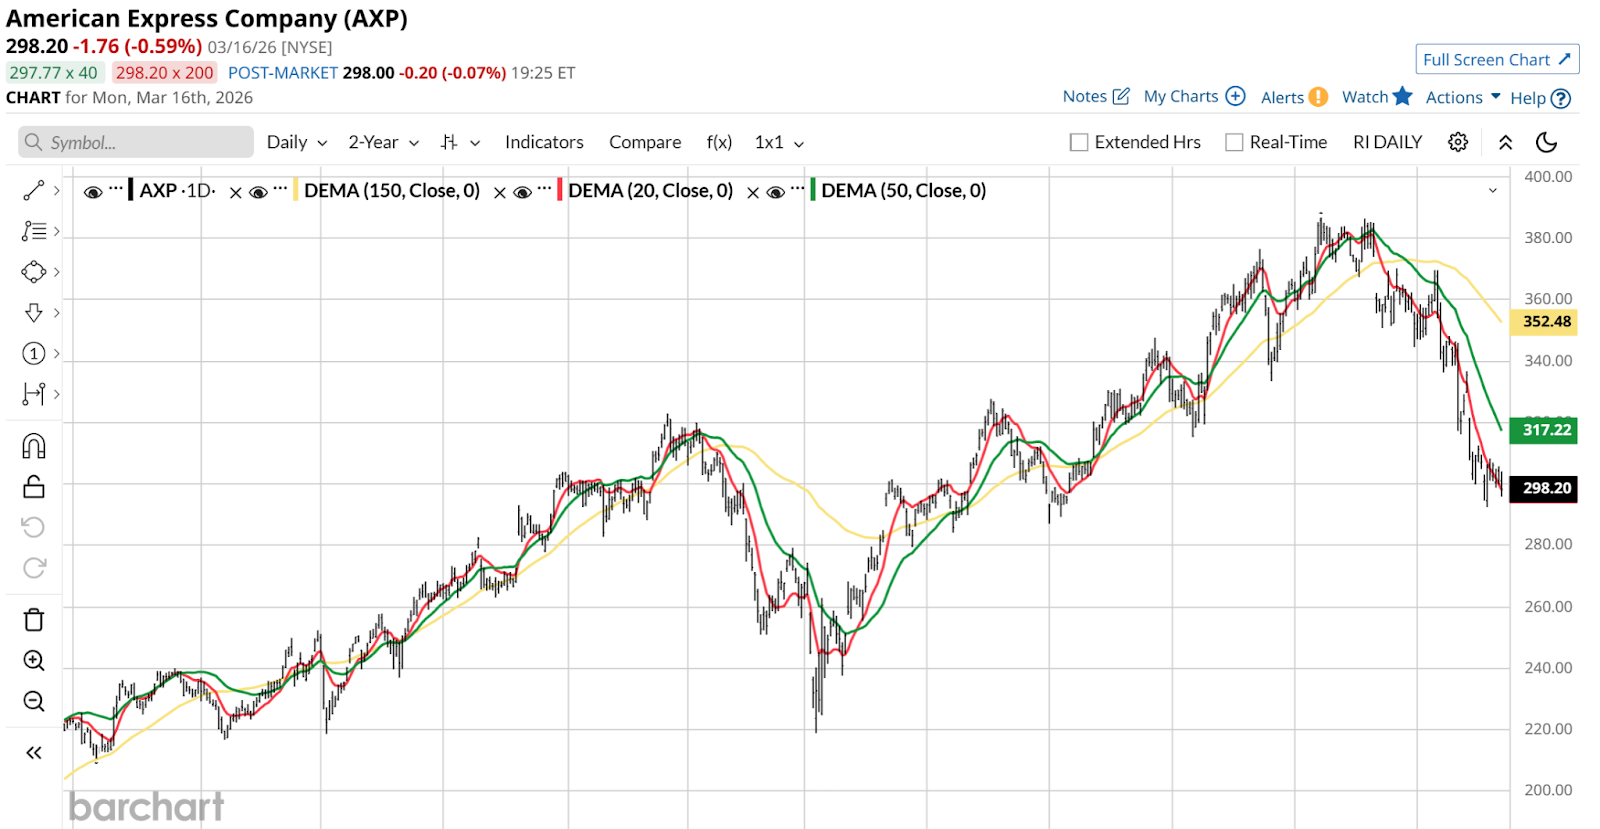
Finally, let’s look at a classic signal of high risk. In this situation, it is one that I’ve been shouting about across the entire financial sector. It has looked terrible for a while now. With American Express (AXP) shown below, it was just fine, in the happy medium 50 level in December, and priced around $380 a share.
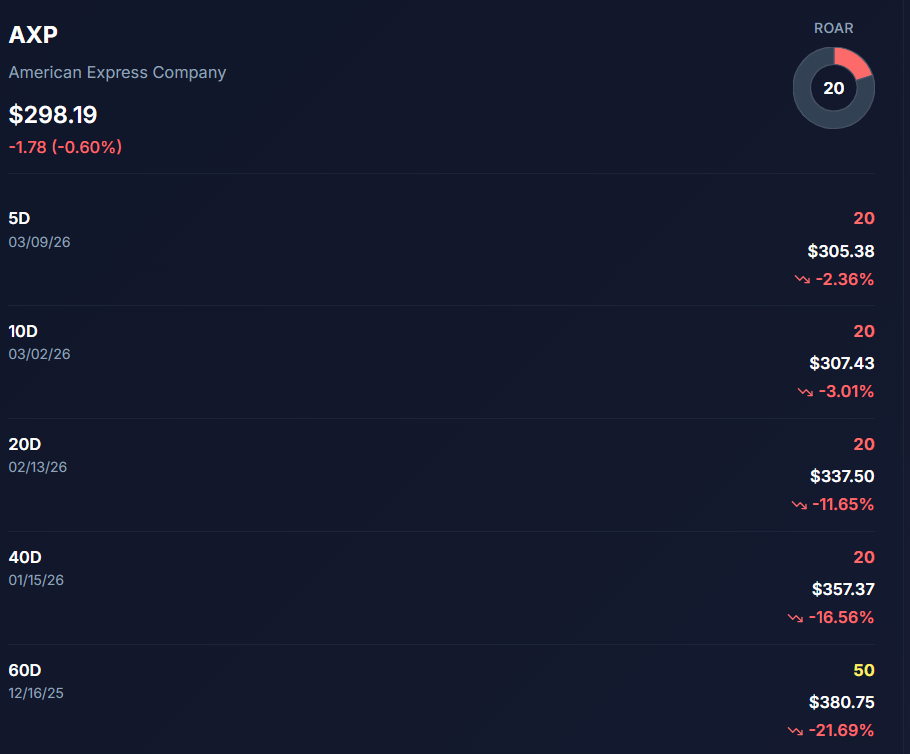
The happy times ended there. The stock has dropped 20% since that time, without more than a fleeting, flailing rally attempt. THAT is where a ROAR Score of 20, not for a day or two, but over a sustained period of days/weeks, can help signal that risk is higher than usual. On Jan. 20, AXP turned down from the yellow zone to red, at a closing price that day of $352. It has been in that red zone every day since.
ROAR is far from the only risk gauge investors can find and train themselves to use. But to me, the key is finding something you can lean on as a ballast, especially in times like this. Buying the dips has been fun, but I’m far less confident it will continue as it has.
So to profit from this environment, be more nimble, take risk of major loss seriously, and figure out which shots are worth taking. And, when to wait for clearer signals of technical strength before lunging into any stock that dips.
Rob Isbitts created the ROAR Score, based on his 40+ years of technical analysis experience. ROAR helps DIY investors manage risk and create their own portfolios. For Rob's written research, check out ETFYourself.com.
On the date of publication, Rob Isbitts did not have (either directly or indirectly) positions in any of the securities mentioned in this article. All information and data in this article is solely for informational purposes. For more information please view the Barchart Disclosure Policy here.
More news from Barchart
- Wall Street Is Still Betting on a Memory ‘Super-Cycle.’ Should You Buy MU Stock Here?
- The Big Short… or The Big Mistake? Why Michael Burry Is Betting Against Nvidia (and What the Data Says)
- 3 High Dividend Growth Kings for Generations of Income That Are Still Rated ‘Buy’
- The Growing Risk in Private Credit: Why BlackRock and JPMorgan Are Raising Alarms