It was an interesting day of trading on Thursday, with all the major indices losing ground, led by a 1.86% decline in the Russell 2000.
As I write this before Friday’s open, the futures are down, suggesting another possible day of losses to finish a week that’s seen the Nasdaq lose 2.8% in the first four days.
Perhaps the worst news yesterday was the jobs data released by Challenger, Gray & Christmas, which showed businesses cut 153,074 jobs in October, the highest October total since 2003.
The job cuts suggest that the Federal Reserve will cut its key interest rate — the federal funds rate — by 0.25 basis points at the December meeting of the FOMC (Federal Open Market Committee). Currently, there is a 66% chance.
However, inflation remains sticky, so it’s also possible that the Fed will pause its rate cuts until 2026.
Today, the University of Michigan’s Consumer Sentiment Index’s preliminary figure for November comes out. It’s expected to be slightly lower than October at 53.0. That’s one of the weakest figures over the past five years.
In the options market yesterday, volume was 66.26 million, 15% above its average daily volume. The top 100 stocks accounted for 79% of the volume. Calls accounted for 58%, while puts accounted for the remaining 42%.
In terms of unusual options activity, there were 1,264 yesterday, with Nexgen Energy’s (NXE) Dec. 19 $45 call leading the way with a Vol/OI (volume-to-open-interest) ratio of 93.74. It’s not often you don’t see at least one in triple digits. That’s a sign of uncertain investors.
As for ETFs, the Invesco Nasdaq QQQ ETF (QQQ), which tracks the 100 largest non-financial stocks on the Nasdaq, had the highest Vol/OI ratio at 119.52. Yesterday’s volume for the Nov. 10 $615 call was 12,072. Expiring on Monday, that’s not the one I’m interested in.
I’m focused on the Sept. 18/2026 $800 QQQ call. It had a volume of 5,014 yesterday, 11.32 times the open interest. Here’s why.

Have an excellent weekend!
I’m Covered-Strangle Obsessed
I’ve written about the Covered Strangle several times in recent months. It’s become my new obsession when it comes to options.
The covered strangle, also known as the Covered Combination, combines a Covered Call and a Cash-Secured Put. It’s generally used when you expect a stock to trade in a narrow range during the life of the option.
The strategy generates income from selling both a call and a put. The risk associated with the trade lies primarily on the downside.
How’s that? Well, let’s say you own 100 shares of XYZ stock. It’s trading at $100. You bought it for $25 four years ago. You sell a $125 call that expires in 45 days. You also sell a put with a $75 strike that expires on the same day as the call.
If in 45 days, XYZ is trading at $135, you’ll have the call assigned to you, forcing you to sell your 100 shares at $125. Not only are you forced to sell a stock that's doing well, but you lose out on $10 a share in gains. Thus, you've capped your upside.
Meanwhile, let’s say the stock falls to $65 in 45 days, $10 below what you paid for it four years ago. The $75 put will be assigned to you, forcing you to buy an additional 100 shares of XYZ stock.
Forgetting the premium income for a second, you’ve now got 200 shares of the stock, with unrealized paper losses of $20 a share. Theoretically, the share price could fall to $0 at expiration, so your downside is unlimited.
The covered strangle is not something you want to do with a volatile stock that moves considerably in either direction.
Why QQQ for 316 Days?
I generally wouldn’t recommend the covered strangle for longer duration options. However, as I said, I’m covered-strangle obsessed. Consider this more an exercise in thinking rather than a down-and-dirty options recommendation. So, here goes.
Here are the closing numbers for the Sept. 18/2026 $800 covered call.

In this example, you didn’t own QQQ until yesterday, when you bought 100 shares at $611.67. That’s a $61,167 outlay. The premium income of $499 [$4.99 bid price] is a 0.82% return. Annualized, that’s a 1.0% return. Hardly worth the risk, am I right? Well, yes and no.
You’ll notice that the potential return should the stock be $800 next September at expiration is 31.8%. That’s a much better return.
The calculation: [$800 strike price + $4.99 bid price + approximately $2.10 a share in dividends paid over 316 days - $611.67 share price) / $611.67 share price - $4.99 bid price = $195.42 / $606.68 = 32.2%]
That’s slightly higher than the 31.9% from above.
Note: QQQ pays a dividend four times a year on the last business day of April, July, October, and December. The ETF would make three payments of approximately $0.70 in December 2025, April 2026, and July 2026.
Now, imagine you bought QQQ at the 52-week low of $402.39 in early April. Your return improves to %
The new calculation: [$800 strike price + $4.99 bid price + approximately $4.10 a share in dividends paid from April 2025 through July 2026 (6 payments) - $402.39 share price) / $402.39 share price - $4.99 bid price = $406.7 / $397.4 = 102.3%.
Timing is everything.
The Downside Risk of the Cash-Secured Put
We’ve completed discussing one half of the trade. Now we need to find a put to sell with a Dec. 18/2026 expiration date. It ought to be 20% or more OTM (out-of-the-money). The $480 put fits the bill.
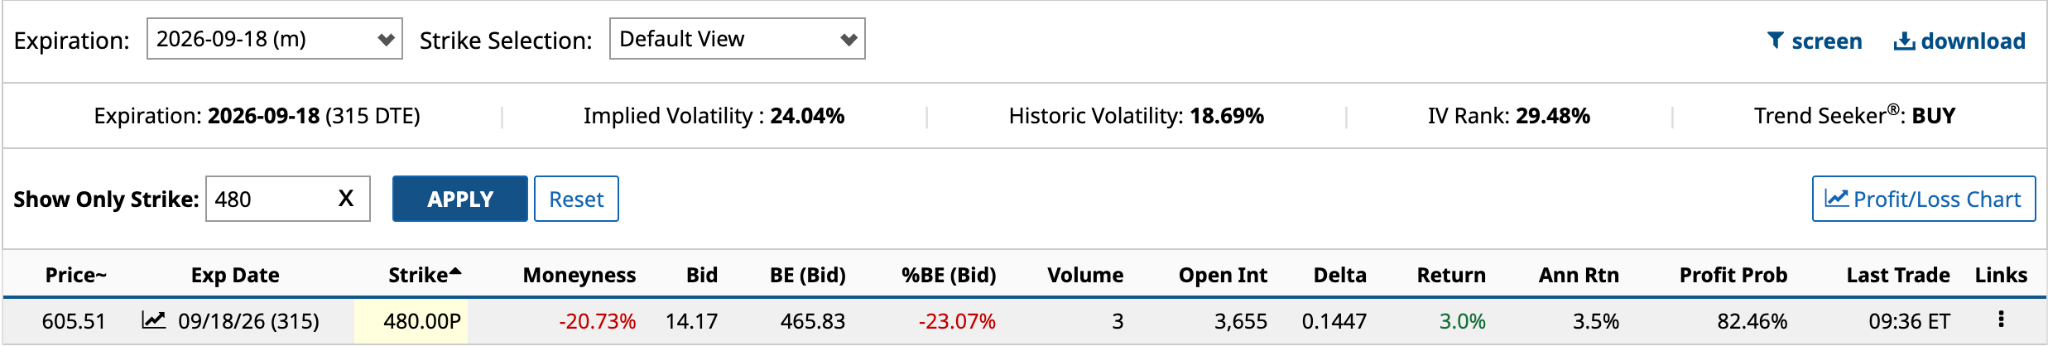
The return from the premium income of $1,417 ($14.17 bid price) is 3.0% [$14.17 bid price / $480 options strike - $14.17 bid price * 365 / 315]. Annualized, it’s 3.5%. Your profit probability is high at 82.46%.
The reason to sell the cash-secured put in this situation is not for the income, but rather to get a better entry point on another 100 QQQ shares. There is, however, the risk that the markets go to rat poop over the next year and the share price flies right through $480 on its way to $380 or worse.
Of course, if things did start to get dicey, you would likely unwind the trade, buying both the call and put you’d previously sold for a loss.
The Bottom Line on QQQ Covered Strangle
The expected move of QQQ to Sept. 18, 2026, is 15.23%, $102.39 below the $800 strike, and $33.25 above the $480 strike. The downside appears more of a concern than the upside. Only time will tell.
Tech stocks account for 64% of the QQQ’s net assets. Of the top 10 holdings, which account for 53% of the portfolio, seven of them have trillion-dollar market caps--and they’re all tech stocks.
The covered strangle options strategy is better suited to DTEs (days to expiration) of 20 to 60 days. The extra days provide enough premium for the trade to be worthwhile, but are short enough for rapid time decay.
As a thought exercise, however, the longer duration covered strangle is an interesting proposition, albeit a risk-enhanced one. Don’t try this at home.
On the date of publication, Will Ashworth did not have (either directly or indirectly) positions in any of the securities mentioned in this article. All information and data in this article is solely for informational purposes. For more information please view the Barchart Disclosure Policy here.
More news from Barchart
- Unusual QQQ Options Activity Prompts Covered Strangle Thought Experiment
- Is McDonald's a Buy? Its Strong FCF Margins Imply MCD Could be 23% Undervalued
- 3 Lemonade Options Showing Unusual Activity—Potential for Holiday Income?
- CAT Stock May Not Have 9 Lives. Here’s My Favorite Way to Trade Caterpillar with Options Here.